Pie Donut Chart. Pie Chart Examples

Competitor Analysis

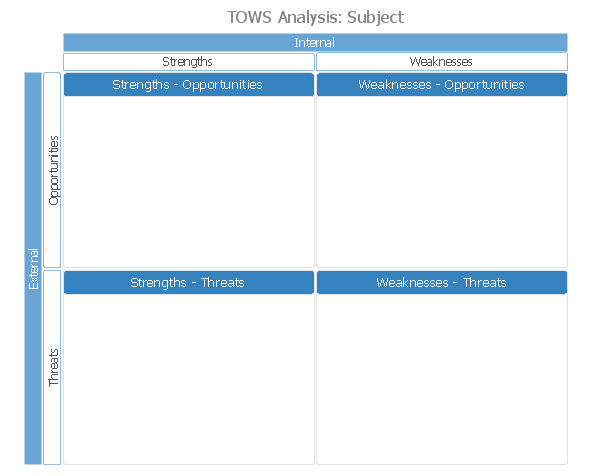
 SWOT and TOWS Matrix Diagrams
SWOT and TOWS Matrix Diagrams solution extends ConceptDraw DIAGRAM and ConceptDraw MINDMAP software with features, templates, samples and libraries of vector stencils for drawing SWOT and TOWS analysis matrices and mind maps.
Data Visualization Solutions

Simple Drawing Applications for Mac

SWOT Matrix

TOWS Analysis Software
Pyramid Chart Examples

Relative Value Chart Software

 Pie Charts
Pie Charts are extensively used in statistics and business for explaining data and work results, in mass media for comparison (i.e. to visualize the percentage for the parts of one total), and in many other fields. The Pie Charts solution for ConceptDraw DIAGRAM offers powerful drawing tools, varied templates, samples, and a library of vector stencils for simple construction and design of Pie Charts, Donut Chart, and Pie Graph Worksheets.
How to Create Presentation of Your Project Gantt Chart

Basic Flowchart Examples

PDPC

 Basic Pie Charts
This solution extends the capabilities of ConceptDraw DIAGRAM (or later) with templates, samples, and a library of vector stencils for drawing pie and donut charts.
- Process Flowchart | Pie Chart Software | Software for Creating ...
- Pie Donut Chart . Pie Chart Examples | Feature Comparison Chart ...
- Venn Diagram Template for Word | Line Chart Template for Word ...
- Mind Maps for Business - SWOT Analysis | How to Draw a Pie Chart ...
- Mac Tools - SWOT Analysis | Flowchart Software | Swot Analysis ...
- Pie Chart Word Template. Pie Chart Examples | How to Make SWOT ...
- SWOT Analysis | SWOT analysis matrix diagram templates | Pie ...
- Competitor Analysis | Marketing Plan Infographic | Bar Chart ...
- Plumbing and Piping Plans | SWOT analysis matrix diagram ...
- Marketing | Matrices | SWOT analysis matrix diagram templates ...
- Competitor Analysis | SWOT Matrix | Pie Donut Chart . Pie Chart ...
- Pie Chart Examples and Templates | Pyramid Diagram and Pyramid ...
- Competitor Analysis | Matrices | Venn Diagram | Market Share ...
- Feature Comparison Chart Software | Bar Chart Template for Word ...
- SWOT Analysis | SWOT Matrix | PROBLEM ANALYSIS. Root Cause ...
- How to Make SWOT Analysis in a Word Document | SWOT Template ...
- Pie Chart Word Template. Pie Chart Examples | How to Draw a ...
- Pie Chart Word Template. Pie Chart Examples | Venn Diagram ...
- Circle Spoke Diagram Template | Best Diagramming | Pie Chart ...
- Pie Charts | Basic Diagramming | Line Chart Template for Word ...