Pie Chart Examples and Templates
A pie chart or a circle graph is a circular chart divided into sectors, illustrating numerical proportion. In a pie chart, the arc length of each sector and consequently its central angle and area, is proportional to the quantity it represents. Pie chart examples and templates created using ConceptDraw PRO software helps you get closer with pie charts and find pie chart examples suite your needs.Chart Templates
Easy charting software comes with beautiful chart templates and examples. This makes it easy to create professional charts without prior experience.Competitor Analysis
Competitor analysis is a first and obligatory step in elaboration the proper corporate marketing strategy and creating sustainable competitive advantage. Use powerful opportunities of numerous solutions from ConceptDraw Solution Park for designing illustrative diagrams, charts, matrices which are necessary for effective competitor analysis.How to Create Presentation of Your Project Gantt Chart
During the planning, discussing and execution of a project you may need to prepare a presentation using project views such as the Gantt Chart, Multiproject Dashboard or Resource Usage View. It’s easy do with ConceptDraw PROJECT!HelpDesk
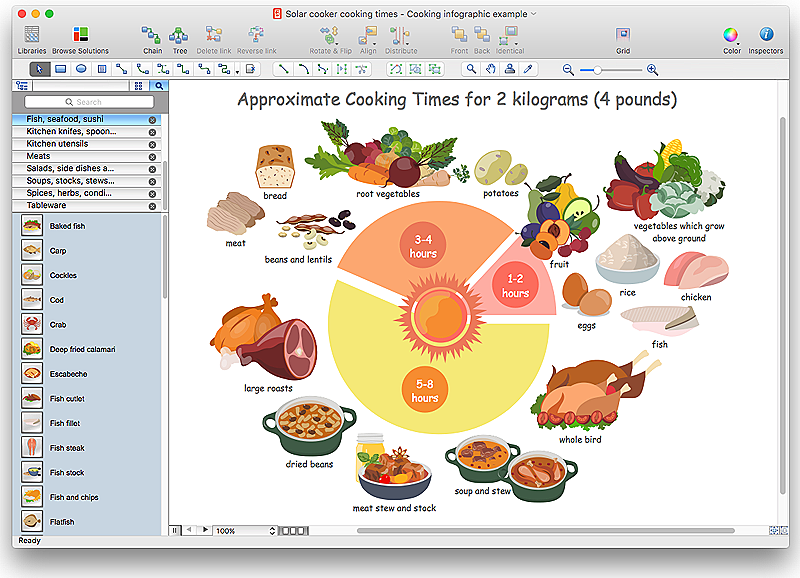
How to Design a Food-related Infographics Using ConceptDraw PRO
Today a large piece of business is referred to a food. This business can not be imagined without various kinds of visualizations. You can see them everywhere — on brand logos, in advertising, on menus and in flyers. Also different food related infographics is used to promote healthy nutrition and to deliver information on how to maintain an effective diet. ConceptDraw Cooking Recipes solution, offers a great collection of bright food-related images and icons, placed into themed libraries. It can be used for catering menu graphics, on marketing flyers, or as concomitant text for infographics.
 Target and Circular Diagrams
This solution extends ConceptDraw PRO software with samples, templates and library of design elements for drawing the Target and Circular Diagrams.
How to Design a Good Workflow
To design a good workflow you have to focus on process analysis, not using the a drawing tool. This is more possible with ConceptDraw PRO software that brings the most natural drawing manner you have ever tried. First, define steps and procedures using simple rectangle shape, then select all shapes and click the Chain button to connect all shapes just in one click. After that you are able to modify some relations if needed.
 Education Package
Education Package is a comprehensive set of multifarious graphical solutions from ConceptDraw Solution Park, collected together in help to ConceptDraw PRO users working in a field of science, education and training, which is aimed at improving the quality of education and helping to design with ease variety of interesting and colorful educational materials, diagrams, charts and maps. Use it to present the information and knowledge in an interesting, clear, structured and simple form to achieve a success in education and pedagogy, to maintain the interest of students and pupils throughout the whole learning process, at the lectures, lessons and even during independent work with additional materials, to contribute to better perception of scientific information by listeners during the conferences and reports.
- Pie Graph Worksheets | Bar Graph | Chart Examples | Images Of Bar ...
- Percentage Pie Chart . Pie Chart Examples | Atmosphere air ...
- Business Report Pie. Pie Chart Examples | Pie Chart | Create ...
- Basic Flowchart Images . Flowchart Examples | Chart Maker for ...
- Picture Chart Templates
- What Is a Picture Graph? | How to Create Presentation of Your ...
- Pie Chart On Balanced Diet
- Scatter Graph Charting Software | Picture Graphs | Business Report ...
- Business Report Pie. Pie Chart Examples | Sales Growth. Bar ...
- Bar Graphs | Sales Growth. Bar Graphs Example | Picture Graphs ...
- Competitor Analysis | Types Of Soil Percentage Bar Graph Pictures
- Beautiful Pictures To Draw On Chart
- Business Report Pie. Pie Chart Examples | Examples of Flowcharts ...
- Pie Chart Software | Pie Chart Word Template. Pie Chart Examples ...
- Food Court | Cooking Recipes | Nutrition Bar Graph And Pie Chart In ...
- Basic Diagramming | Area Chart | Visual Presentations Made Easy ...
- Pie Graph Worksheets | Business Report Pie. Pie Chart Examples ...
- Pie Chart Examples and Templates | Chart Examples | Pie Graph ...
- Fast Food Pie Chart
- Chart Examples | Process Flowchart | Pie Chart Examples and ...


