 Healthcare Management Workflow Diagrams
Healthcare Management Workflow Diagrams solution contains large set of colorful samples and libraries with predesigned vector pictograms and symbols of health, healthcare equipment, medical instruments, pharmaceutical tools, transport, medication, departments of healthcare organizations, the medical icons of people and human anatomy, as well as the predesigned flowchart objects, connectors and arrows, which make it the best for designing clear and comprehensive Medi?al Workflow Diagrams and Block Diagrams, Healthcare Management Flowcharts and Infographics, Healthcare Workflow Diagram, for depicting the healthcare workflow and clinical workflows in healthcare, for making the workflow analysis healthcare and healthcare workflow management.
This circle-spoke diagram sample shows the type 1 diabetes (T1D) TrialNet clinical center and three affiliate centers. It was designed on the base of the circle-spoke diagram from the webpage "Type 1 Diabetes TrialNet: Clinical Centers" from the website of the U.S. National Institutes of Health (NIH).
"The National Institute of Diabetes and Digestive and Kidney Diseases (NIDDK) is seeking applications for TrialNet Clinical Centers to participate in multi-center clinical research studies aimed at prevention, delay of progression, or remission of T1D. These Clinical Centers will also be responsible for the oversight of a network of TrialNet Affiliate Centers involved in TrialNet study recruitment and follow-up.
TrialNet seeks to continue to study therapies (such as immunotherapies) aimed at preventing or delaying the development of T1D in persons at risk. Depending upon available evidence, initial studies may be conducted in patients with recent onset of T1D and will be aimed at decreasing b-cell destruction and/ or enhancing b-cell survival in persons with recently-diagnosed T1D and evidence of residual b-cell function. If such treatments are effective and safe, clinical trials to prevent development of T1D in at-risk individuals may be initiated." [grants.nih.gov/ grants/ guide/ rfa-files/ RFA-DK-08-011.html]
The diagram example "TrialNet clinical center" was created using the ConceptDraw PRO diagramming and vector drawing software extended with the Circle-Spoke Diagrams solution from the area "What is a Diagram" of ConceptDraw Solution Park.
Used Solutions
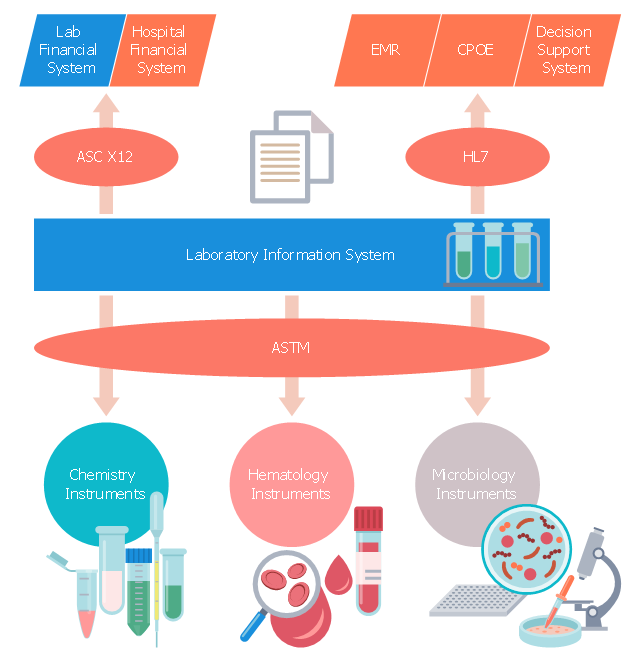
This medical flow chart sample shows logical connections to/ from laboratory information system (LIS) within the hospital.
It was drawn on the base of Wikimedia Commons file: WithinHospital.jpg. [commons.wikimedia.org/ wiki/ File:WithinHospital.jpg]
This file is licensed under the Creative Commons Attribution-Share Alike 3.0 Unported license. [creativecommons.org/ licenses/ by-sa/ 3.0/ deed.en]
"A laboratory information management system (LIMS), sometimes referred to as a laboratory information system (LIS) or laboratory management system (LMS), is a software-based laboratory and information management system with features that support a modern laboratory's operations. Key features include — but are not limited to — workflow and data tracking support, flexible architecture, and data exchange interfaces, which fully "support its use in regulated environments". The features and uses of a LIMS have evolved over the years from simple sample tracking to an enterprise resource planning tool that manages multiple aspects of laboratory informatics." [Laboratory information management system. Wikipedia]
The medical flowchart example "Laboratory Information System within the hospital" was designed using ConceptDraw PRO software extended with Healthcare Workflow Diagrams solution from Business Processes area of ConceptDraw Solution Park.
The vector stencils library "Medicine and health pictograms" contains 20 icons of medical and healthcare symbols.
Use it to draw your medical and healthcare infographics.
The example "Medicine and health pictograms - Vector stencils library" was created using the ConceptDraw PRO diagramming and vector drawing software extended with the Pictorial infographics solution from the area "What is infographics" in ConceptDraw Solution Park.
- Diagram Of A Hb Pipette
- Pipette Pictogram
- Healthcare Management Workflow Diagrams | Medicine and health ...
- UML Class Diagram Example - Medical Shop | Biology Drawing ...
- Medicine and health pictograms - Vector stencils library | Medicine ...
- Prioritization matrix - Health care problems | Relations diagram ...
- Healthcare Management Workflow Diagrams | Flowchart Marketing ...
- How to Create an IDEF0 Diagram for an Application Development ...
- U.S. Medicare spending per capita | Process Flowchart | Pie Charts ...
- Dna model of seduction - Triangular diagram | Education pictograms ...
