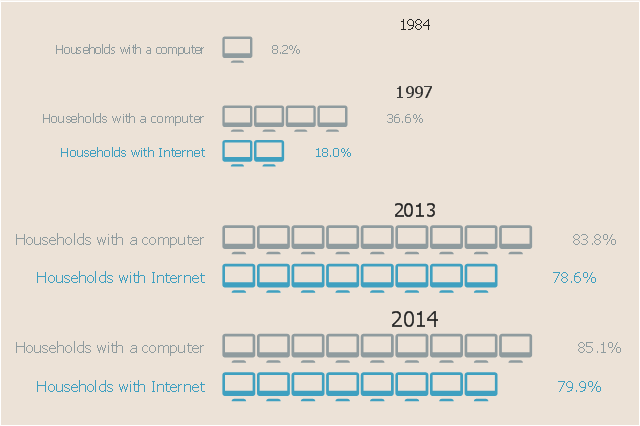
This picture bar graph sample shows the computer and Internet use at home from 1984 to 2014. It was designed using data from website of the United States Census Bureau (USCB).
[census.gov/ content/ dam/ Census/ library/ visualizations/ 2016/ comm/ digital_ nation.png]
"Home automation is the residential extension of building automation and involves the control and automation of lighting, heating, ventilation, air conditioning (HVAC), appliances, and security. Modern systems generally consist of switches and sensors connected to a central hub sometimes called a "gateway" from which the system is controlled with a user interface that is interacted either with a wall-mounted terminal, mobile phone software, tablet computer or a web interface." [Home automation. Wikipedia]
The pictorial chart example "Computer and Internet use at home over time" was created using the ConceptDraw PRO diagramming and vector drawing software extended with the Picture Graphs solution from the Graphs and Charts area of ConceptDraw Solution Park.
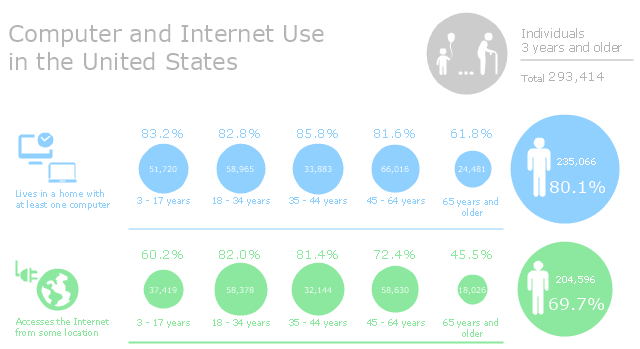
This infographic sample was created on the base of "Computer and Internet Use in the United States. Population Characteristics. Thom File. Issued May 2013." from the website of U.S. Census Bureau (U.S. Department of Commerce. Economics and Statistics Administration). [census.gov/ prod/ 2013pubs/ p20-569.pdf]
The infogram example "Computer and Internet Use in the United States" was created using the ConceptDraw PRO diagramming and vector drawing software extended with the Pictorial Infographic solition from the area "What is infographics" in ConceptDraw Solution Park.
The infogram example "Computer and Internet Use in the United States" was created using the ConceptDraw PRO diagramming and vector drawing software extended with the Pictorial Infographic solition from the area "What is infographics" in ConceptDraw Solution Park.
The vector stencils library "IVR Internet" contains 36 interactive voice response (IVR) Internet and web pictograms. Use it to design your IVR diagrams with ConceptDraw PRO diagramming and vector drawing software.
"A pictogram, also called a pictogramme, pictograph, or simply picto, and in computer usage an icon, is an ideogram that conveys its meaning through its pictorial resemblance to a physical object. Pictographs are often used in writing and graphic systems in which the characters are to a considerable extent pictorial in appearance. ...
Pictographs remain in common use today, serving as pictorial, representational signs, instructions, or statistical diagrams." [Pictogram. Wikipedia]
The IVR diagram symbols example "Design elements - IVR Internet" is included in the Interactive Voice Response Diagrams solution from the Computer and Networks area of ConceptDraw Solution Park.
Internet solutions with ConceptDraw PRO
ConceptDraw is a good means of visualization of information of any kind as it features powerful graphic capabilities. The conception of using ConceptDraw and open formats by the programs that work with Internet can be used for displaying any data and any structure in Internet.- Uses Of Internet In Pictorial Chart
- Design elements - IVR Internet | How to Draw Pictorial Chart. How to ...
- Computer and Internet use at home over time | How to Draw Pictorial ...
- Use Of Computer And Internet Diagram And Charts
- Design Pictorial Infographics. Design Infographics | Design ...
- IVR Internet - Vector stencils library | Hotel locator map | 3D pictorial ...
- Design elements - IVR Internet | Design Pictorial Infographics ...
- Column Chart Software | How to Draw Pictorial Chart. How to Use ...
- Design elements - Marketing pictograms | Design elements - IVR ...
- IVR Internet - Vector stencils library | 3D pictorial street map | Gis ...
- Internet Marketing Infographic | Infographic Generator | How to Draw ...
- Internet Uses
- Basic Diagramming | How to Draw Pictorial Chart. How to Use ...
- Computer and Internet use at home over time | Manufacturing in ...
- People pictograms - Vector stencils library | Computer and Internet ...
- Design elements - IVR Internet | Design elements - Marketing ...
- Internet Connectivity. Computer and Network Examples | Internet ...
- Design elements - Management pictograms | Design elements ...
- Basic Flowchart Symbols and Meaning | Computer and Internet use ...
- Example Of Pictorial Graph


