HelpDesk
How to Track Your Project Plan vs. the Actual Project Condition

HelpDesk
How to Set a Project Baseline

HelpDesk
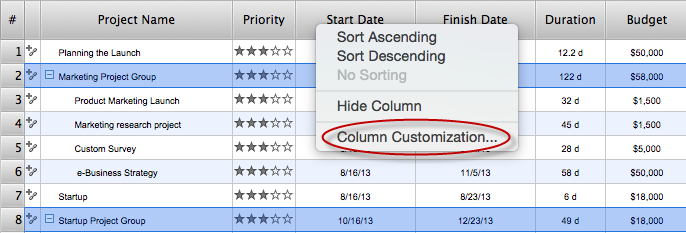
What Information to be Displayed in the ConceptDraw PROJECT Gantt Chart View

HelpDesk
What Information can be Displayed in the Multiproject Dashboard View
Landscape Plan

 PM Planning
The PM Planning solution extends the functional abilities of ConceptDraw MINDMAP and ConceptDraw PROJECT software, allowing to automatically create the spreadsheets reflecting the tasks and project statuses for people who have different project roles. The reporting capabilities of this solution are represented by the possibility to generate a wide range of project reports that allow the project managers, senior management and other project participants to be informed on a project daily progress and monthly objectives: All Inclusive Report, All Visible Columns, Milestones with Notes and Objectives, Projects Goals, Projects Managers, Project Team, and Top Level Tasks. The PM Planning solution from ConceptDraw Solution Park is a strong project management and productivity tool which simplifies the process of reporting and lets one create a document with the desired report, includes the predesigned examples, extends and improves the planning capabilities for all team members, improves the project communication, helps to accurately plan, maintain, and finish projects on time, to track the work of project resources, to perform the analytical work and to make effective decisions.
Landscape Plan
Work Order Process Flowchart. Business Process Mapping Examples

- Report Plan Vs Actual In Microsoft Project Planner
- How to Export Project Data to MS Excel Worksheet | How to Track ...
- How to Track Your Project Plan vs . the Actual Project Condition ...
- Types Of Ms Project Dashboard Report
- Microsoft Office Project Planner
- Difference Between Microsoft Project And Gantt Charts
- Project Management Area | How to Track Your Project Plan vs . the ...
- How to Track Your Project Plan vs . the Actual Project Condition ...
- Gantt Chart Software | How to Track Your Project Plan vs . the Actual ...
- How To Make A Report On A Project
- How to Report on Project Milestones Using a Mind Map | One ...
- How to Export Project Data to MS Excel Worksheet | How to Report ...
- How To Create Project Report | How to Track Your Project Plan vs ...
- What Makes ConceptDraw PRO the Best Alternative to MS Visio ...
- Microsoft Project Charts
- How to Customize the Default Project File on Mac | How to Plan ...
- How to Import MS Project File to a Mind Map Using the Project ...
- Construction Project Chart Examples | Project Management Area ...
- How To Create Project Report | How to Publish Project Reports on ...
- PM Dashboards | How to Create Project Dashboard on Mac | Status ...