This site uses cookies. By continuing to browse the ConceptDraw site you are agreeing to our Use of Site Cookies.

Planogram Software and Retail Plan Software

The ConceptDraw DIAGRAM Planogram Software and Retail Plan Software offers powerful tools of Enterprise Architecture Diagrams Solution for visualization the market analysis and easy making successful Retail Plans and Planograms with useful detailed recommendations about placing products and optimization the shelf space.

Planogram

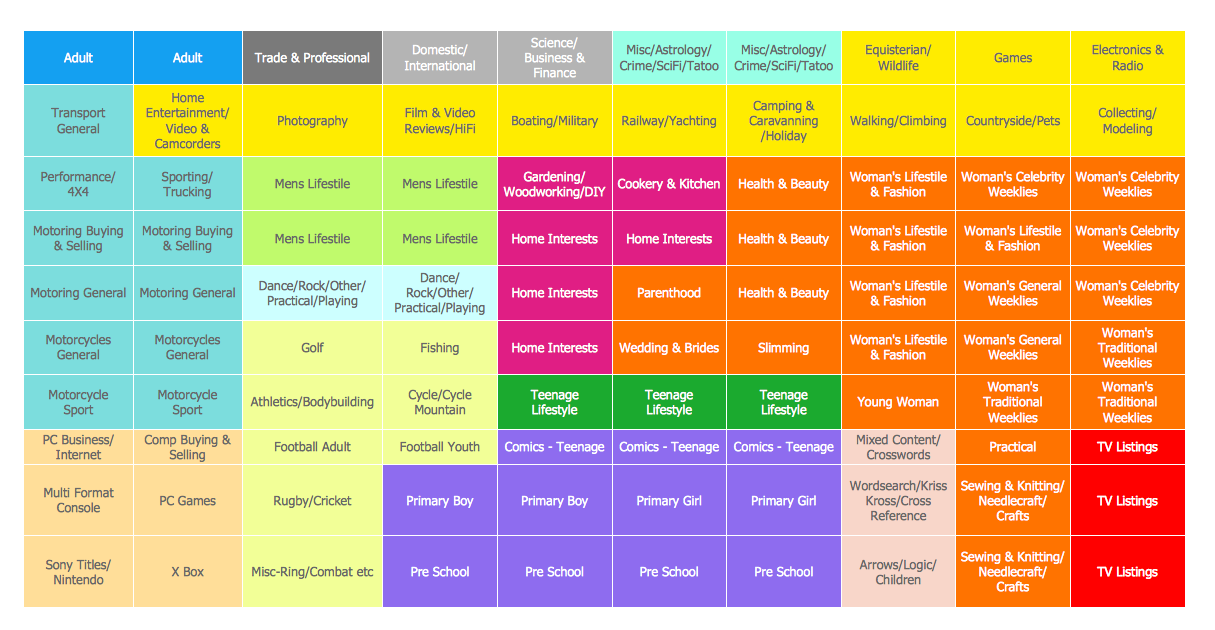
This example shows the planogram for magazines. This example was created in ConceptDraw DIAGRAM diagramming and vector drawing software using the Basic Diagramming Solution from the Universal Diagramming area of ConceptDraw Solution Park.

Organizational Chart Templates

ConceptDraw offers you a number of ready-made organizational chart templates which you can use in your drawing. They are grouped in topical sets as organizational chart template files. Use the Organizational Charts Solution for ConceptDraw DIAGRAM to create your own Organizational Charts of any complexity quick, easy and effective. The Organizational Charts designed with ConceptDraw DIAGRAM are vector graphic documents and are available for reviewing, modifying, converting to a variety of formats (image, HTML, PDF file, MS PowerPoint Presentation, Adobe Flash or MS Visio XML), printing and send via e-mail in one moment.
How to draw an Organizational Chart

Creating a default presentation in ConceptDraw MINDMAP

ConceptDraw MINDMAP a versatile, yet easy-to-use tool for organizing ideas and data. Creates mind maps that intuitively illustrate your thought process. Outputs a wide variety of document styles and formats. Delivers presentations from mind maps with built-in modes and MS PowerPoint export. Perfect for brainstorming, project planning, meeting management, note taking, and more.

ConceptDraw MINDMAP : Brainstorming, Mind Mapping for macOS and Windows

ConceptDraw MINDMAP is a powerful business and personal productivity software application that provides visual organization and access to information for individuals and organizations.

Store Layout Software

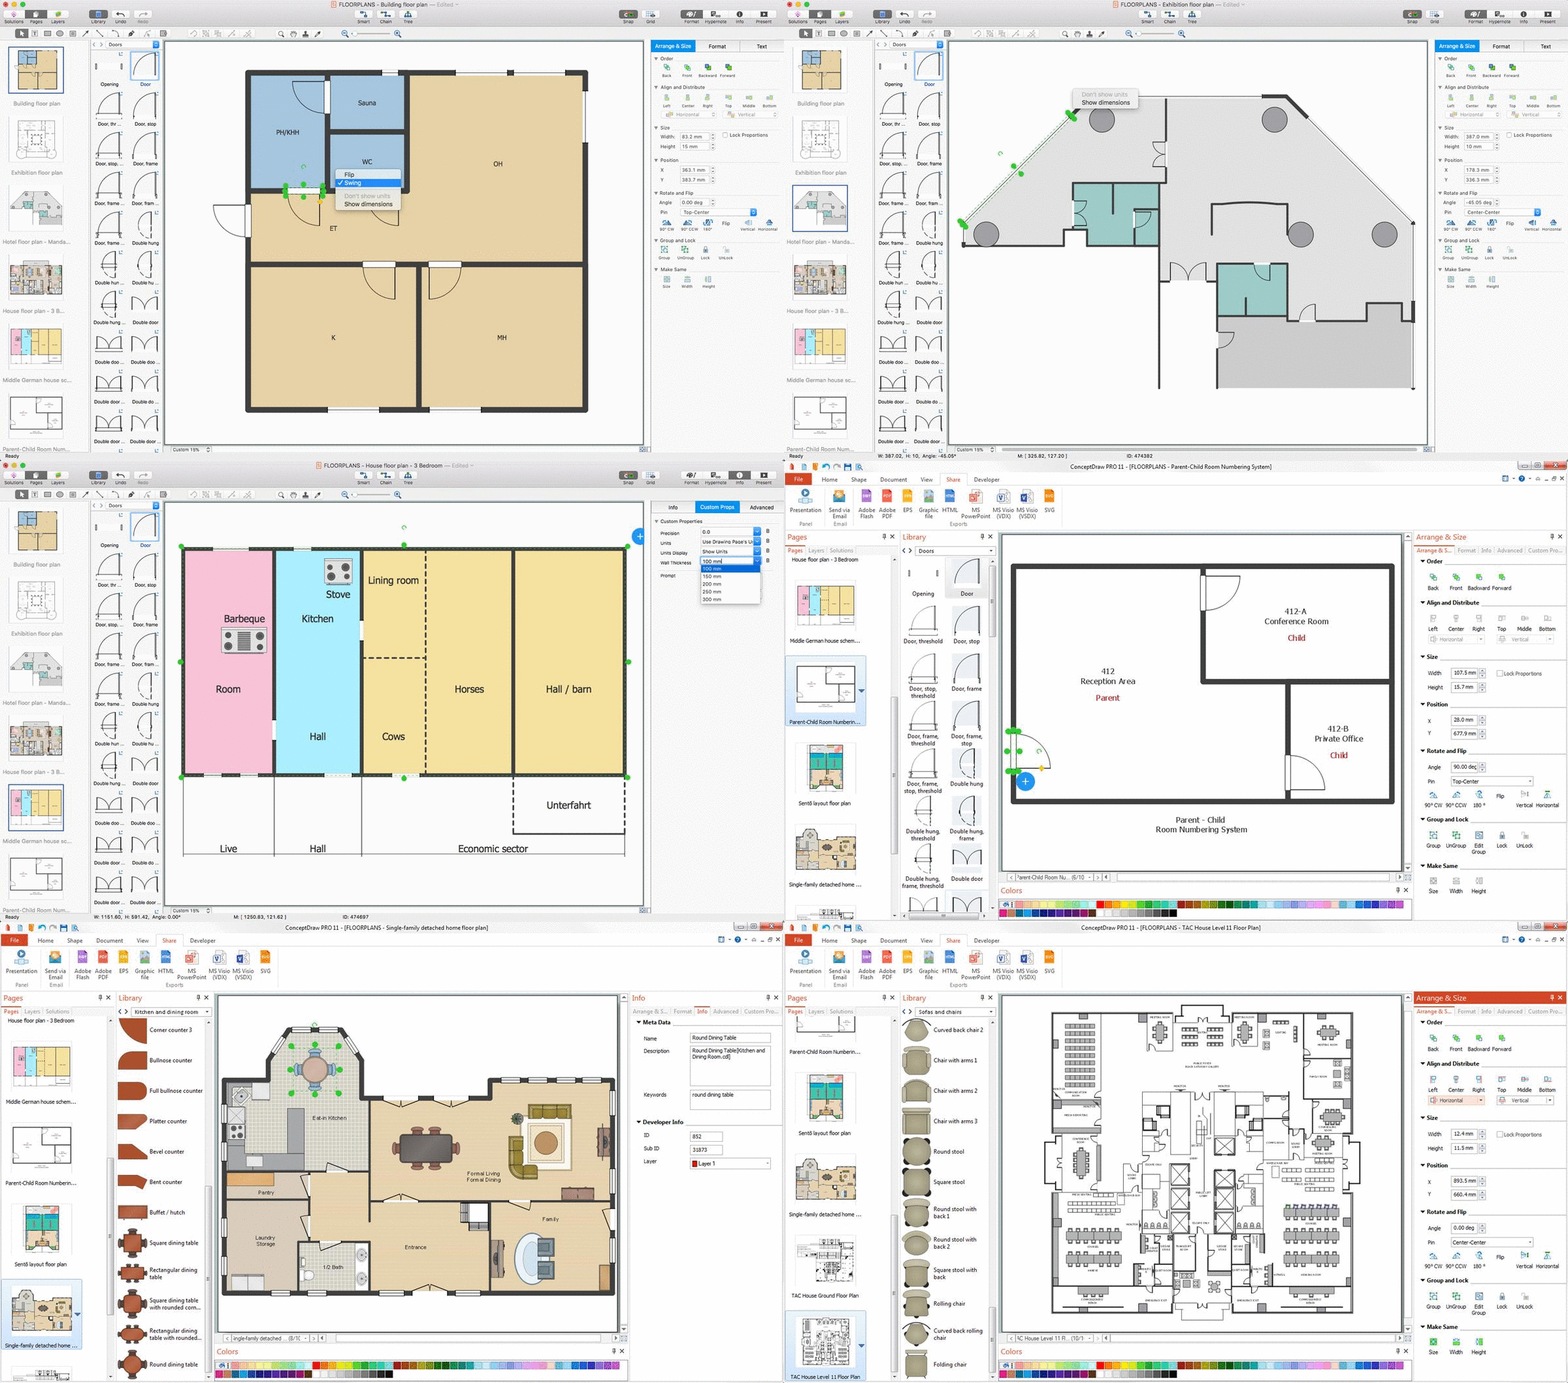
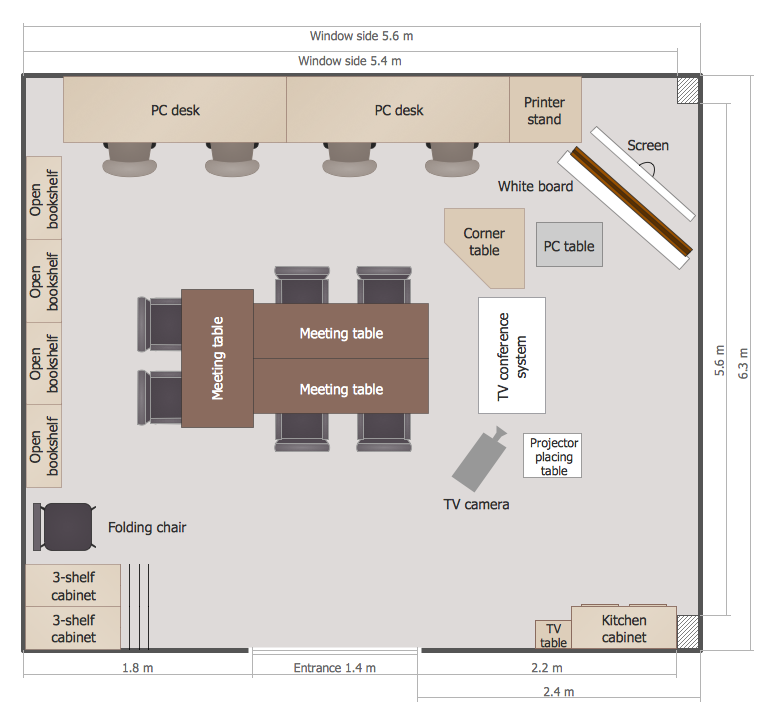
Creation of Store layout, Shop floor plan, Plans for warehouse and industrial premises, is one of the most important stages in development and design of the store, supermarket or shopping center. Layouts and plans help us clearly imagine our project after implementation, to consider all details, and improve it if necessary. The optimal store layout and design, proper zoning, well thought-out placement of the trade equipment, significantly increase the profit of the shop. ConceptDraw DIAGRAM is ideal store layout software that allows easy and professionally create varied Store layouts, Shop designs, Planograms, Designs for сommercial spaces, Cafe floor plans, Restaurant layouts, Office floor plans, House floor plans, and many others layouts thanks to the powerful tools offered by Floor Plans solution included to Building Plans area of ConceptDraw Solution Park. It includes many examples, quick-start templates and predesigned vector stencils libraries. With all this tools you don't need more to be professional artist to create great-looking Store layouts.

Home Design Software

The ConceptDraw DIAGRAM Home Design Software extended with Floor Plans solution from the Building Plans area of ConceptDraw Solution Park offers the powerful tools which will help you in easy developing vivid and professional-looking: Building plans, Home plans, House designs, Floor plans, Home interior designs, Furniture and equipment layouts.

Emergency Plan

The Fire Emergency Plan illustrates the scheme of the building and location of the main and fire exits for a safe evacuation, and clearly defines directions to them on the plan. Fire Emergency Plans are constructed on the case of unexpected or emergency situations, fires, hazardous leaks, natural disasters, and other sudden events. They must to be obligatorily on the plain sight at every building and on each floor, at living houses and apartments, schools and universities, medical centers, clinics and hospitals, office buildings, banks, cafes, restaurants, and also at all other public buildings and institutions. The Evacuation plans and Emergency Plans preliminary designed in ConceptDraw DIAGRAM software help employees and family members when some emergency events happen and let avoid the accidents and sad consequences, prevent injuries and fatalities, allow reduce damages and speed the work resumption. Start drawing emergency blueprint from floor bounds, then add the inner walls and doors, and finally use bright arrows to visually show evacuation directions to fire exits. ConceptDraw is a serious alternative to Visio. It's a desktop based solution aimed at professional designers working in CAD environments. It is also a good option for those who work between Mac and PC because one license is valid for both.
How to Draw a Floor Plan

Data Flow Diagrams

Data Flow Diagram (DFD) is a special chart type which lets graphically illustrate the "flow" of data through an information system. So the Data Flow Diagrams can be successfully used for visualization of data processing or structured design, for creation an overview of the system, for business process modeling, for exploring the high-level design in terms of data flows and documenting the major data flows. Inclusion of powerful Data Flow Diagrams solution to the Software Development area of ConceptDraw Solution Park makes the ConceptDraw DIAGRAM a beneficial data flow diagramming software and supplies it with numerous collection of quick-start templates, professionaly designed samples, and extensive range of ready-for-use vector objects consisting the Data Flow Diagrams, Gane-Sarson Notation, and Yourdon and Coad Notation libraries. Use the ConceptDraw DIAGRAM application to design easy and quickly the Data Flow Diagrams including the data storages, data flows, external entities, functional transforms, control transforms and signals.

Sales Process Steps

Sales process engineering is a complex and labour-intensive process which requires a lot of time, efforts, and powerful software. We recommend to use the ConceptDraw DIAGRAM software enhanced with Sales Flowcharts solution from the Marketing area of ConceptDraw Solution Park. It gives the possibility to easy illustrate all sales process steps and their results.

Restaurant Floor Plan Software

The restaurant is a beautiful place for relax and recreation. But not all the restaurants are popular. What is the secret of popularity and active visiting of some restaurant? People pay special attention for design and atmosphere, they must be pleasant and unique. All design elements, correct planning and furniture layout, location of the main hall and kitchen, beautiful music and good service, delicious dishes, create an unforgettable atmosphere of comfort, harmony, and convenience. Having a powerful ConceptDraw DIAGRAM software extended with Cafe and Restaurant Plans solution from Building Plans Area of ConceptDraw Solution Park, you can create your unique and successful Restaurant Floor plans, Restaurant layouts, and Restaurant designs in a few minutes. This solution includes a lot of Restaurant floor plan samples, examples, templates, and variety of libraries with professionally designed vector objects of different furniture, appliances, and other restaurant design elements helpful for fast and easy drawing Floor plan of restaurant.

SWOT Analysis Marketing Tool: A Comprehensive Guide

Using mind mapping to define Strengths, Weaknesses/Limitations, Opportunities, and Threats is a natural fit. SWOT mind maps quickly capture your ideas, and allow you to add and subtract easily, ensuring you don’t overlook any important items.

Sentence Diagrammer

Sentence a grammatical unit of several words, and provides a narrative, question, comment, etc. It begins with a capital letter and ends with proper punctuation. Sentence diagramming allows you to visually present the sentence part function, which helps you build right sentences. Language Learning solution offers the Sentence Diagrams Library with set of vector stencils for drawing various Sentence Diagrams, for visualizing grammatical structures that will assist you in language learning and construction of grammatically correct sentences. ConceptDraw DIAGRAM diagramming software extended with Language Learning solution from the Science and Education area provides the powerful sentence diagraming tools.

Piping and Instrumentation Diagram Software

Piping and Instrumentation Diagram is a technical sketch or drawing, which shows in details the piping system and instrumentation of a processing plant. Piping and Instrumentation Diagram is developed by process design engineers and technical engineers on the phase of plant design. This plan is necessary on the stages of plant construction and then is actively used by operators, instrumentation and piping engineers when operating the plant. ConceptDraw DIAGRAM software provides unique Plumbing and Piping Plans solution from Building Plans area of ConceptDraw Solution Park with 10 libraries of ready-to-use predesigned vector elements, templates and samples, to help you create professional Piping diagrams and schematics, Instrumentation diagrams, Plumbing plans and blueprints, Schemes of hot and cold water supply systems, Heating schemes, Mechanical diagrams, Diagrams of fluids, hydraulics, air and gas pipings, Technical drawings of waste water disposal systems, Schematics of industrial piping systems, Diagrams of ventilation systems, etc.

Interior Design. Piping Plan — Design Elements

The pipe laying and setting the plumbing system at new apartment or home, or replacing the worn plumbing begins from the choice of materials, sizes of pipes and creation the plan. When developing a piping system, the engineer should take into account many aspects, such as advantages and disadvantages of different pipes materials, the temperature changes (freezing or thermal expansion) that effect on pipes. The most commonly used are steel pipes which have passed the test of time, but they are difficult for assembling and prone to corrosion, plastic (polypropylene) pipes that are characterized by low weight and price, ease of installation and durability, and also PEX-AL-PEX pipes. Numerous libraries with ready-to-use design elements of pipes, valves and other plumbing and piping equipment included to Plumbing and Piping Plans solution for ConceptDraw DIAGRAM help easy design Piping and Plumbing interior design plans, blueprints, schematic diagrams, technical drawings of waste water disposal systems, hot and cold water supply systems.

DFD Flowchart Symbols

A Data Flow Diagram (DFD) is a graphical technique which allows effectively model and analyze the information processes and systems. The ability to fast and easy create the DFDs is made possible with Data Flow Diagrams solution from the Software Development area of ConceptDraw Solution Park. For designing the Data Flow Diagrams are used simple DFD flowchart symbols which are connected each other by arrows depicting the data flow from one step to another.

Electrical Symbols — IGFET

There are several types of insulated gate field-effect transistors (IGFETs) in common use. The early term metal oxide semiconductor field-effect transistor (MOSFET) is still in use, and MOSFET is usually acceptable as a generic term for IGFETs. The metal oxide, and the insulation in the IGFET, is the insulating material between the gate terminal and the substrate between the source and drain terminals. This insulator must have very low leakage, of course, but another requirement for good performance of the transistor is that the dielectric constant of the material must be very high. 26 libraries of the Electrical Engineering Solution of ConceptDraw DIAGRAM make your electrical diagramming simple, efficient, and effective. You can simply and quickly drop the ready-to-use objects from libraries into your document to create the electrical diagram.

Pareto Chart

This sample shows the Pareto Chart of titanium investment casting defects. On the Pareto chart at the same time are displayed a bar graph and a line graph. The descending values are represented by the bars and the cumulative total values are represented by the line. Pareto charts are widely used in the areas of the quality improvement and the time management.

Electrical Schematic

You need design Electrical Schematic and dream to find the useful tools to draw it quick and easy? ConceptDraw DIAGRAM offers the unique Electrical Engineering Solution from the Industrial Engineering Area which will effectively help you!

Percentage Spider Chart

ConceptDraw PRO creates drawings, diagrams and charts with great visual appeal in Mac OS X. This sample shows the Spider Chart that represents the buyer perceptions of the leather footwear industries in Brazil, India and Italy.