Planogram Software and Retail Plan Software
The ConceptDraw DIAGRAM Planogram Software and Retail Plan Software offers powerful tools of Enterprise Architecture Diagrams Solution for visualization the market analysis and easy making successful Retail Plans and Planograms with useful detailed recommendations about placing products and optimization the shelf space.Store Layout Software
Creation of Store layout, Shop floor plan, Plans for warehouse and industrial premises, is one of the most important stages in development and design of the store, supermarket or shopping center. Layouts and plans help us clearly imagine our project after implementation, to consider all details, and improve it if necessary. The optimal store layout and design, proper zoning, well thought-out placement of the trade equipment, significantly increase the profit of the shop. ConceptDraw DIAGRAM is ideal store layout software that allows easy and professionally create varied Store layouts, Shop designs, Planograms, Designs for сommercial spaces, Cafe floor plans, Restaurant layouts, Office floor plans, House floor plans, and many others layouts thanks to the powerful tools offered by Floor Plans solution included to Building Plans area of ConceptDraw Solution Park. It includes many examples, quick-start templates and predesigned vector stencils libraries. With all this tools you don't need more to be professional artist to create great-looking Store layouts.CORRECTIVE ACTIONS PLANNING. Involvement Matrix
The Involvement Matrix can identify the distribution of responsibilities and identify roles in a group or team. Use the Involvement Matrix to specify roles and responsibilities of actions in problem solving. ConceptDraw Office suite is a software for corrective actions planning.
How to Present a Social Media Response Plan DFD to Your Team
Interactive tool helps you find the appropriate response to social media mentions quickly. There are materials to help trainers and consultants develop a social media strategy and provide training for social media groups on how to effectively accomplish their daily work.School Floor Plans
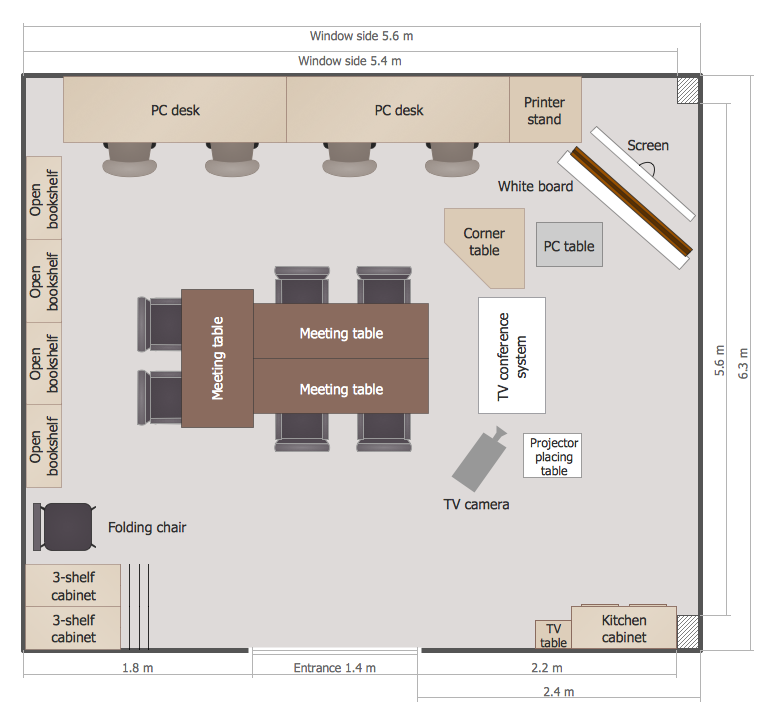
ConceptDraw DIAGRAM is a powerful diagramming and vector drawing software. Extended with School and Training Plans Solution from the Building Plans Area it became the best software for quick and easy designing various School Floor Plans.Restaurant Floor Plan Software
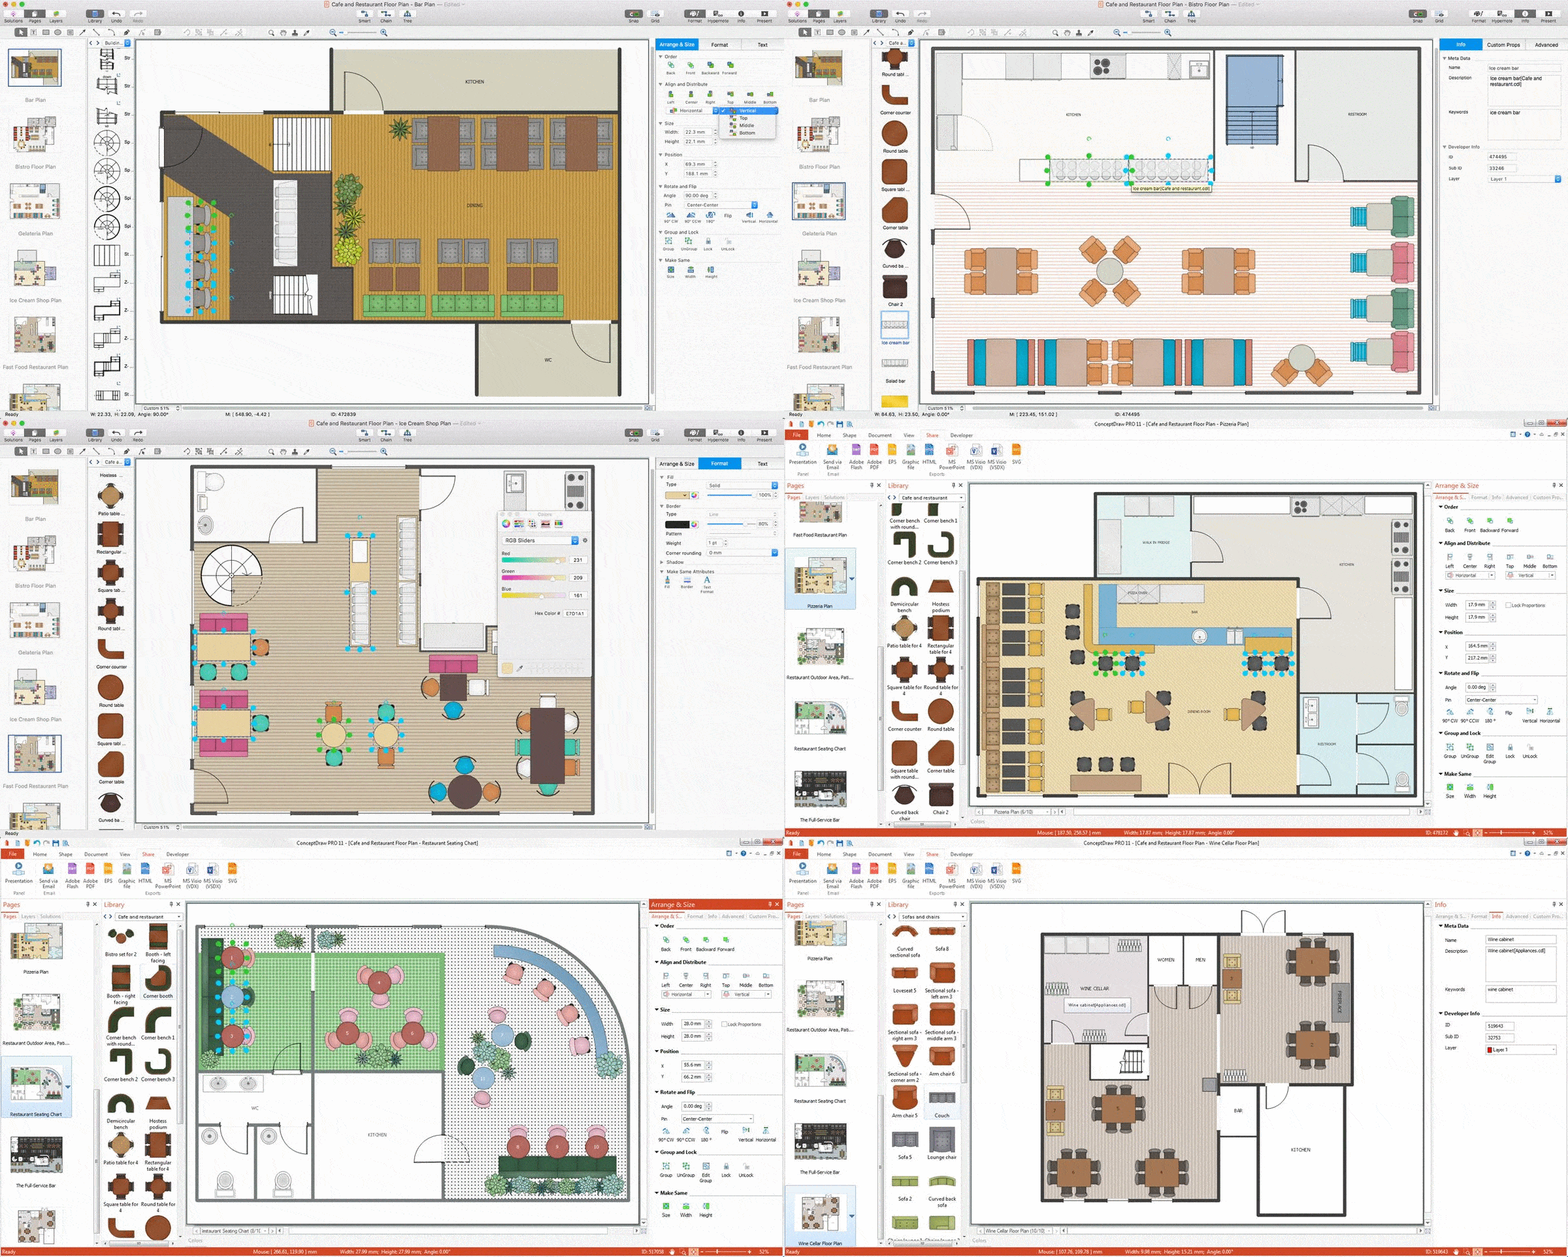
The restaurant is a beautiful place for relax and recreation. But not all the restaurants are popular. What is the secret of popularity and active visiting of some restaurant? People pay special attention for design and atmosphere, they must be pleasant and unique. All design elements, correct planning and furniture layout, location of the main hall and kitchen, beautiful music and good service, delicious dishes, create an unforgettable atmosphere of comfort, harmony, and convenience. Having a powerful ConceptDraw DIAGRAM software extended with Cafe and Restaurant Plans solution from Building Plans Area of ConceptDraw Solution Park, you can create your unique and successful Restaurant Floor plans, Restaurant layouts, and Restaurant designs in a few minutes. This solution includes a lot of Restaurant floor plan samples, examples, templates, and variety of libraries with professionally designed vector objects of different furniture, appliances, and other restaurant design elements helpful for fast and easy drawing Floor plan of restaurant.Restaurant Floor Plans Samples
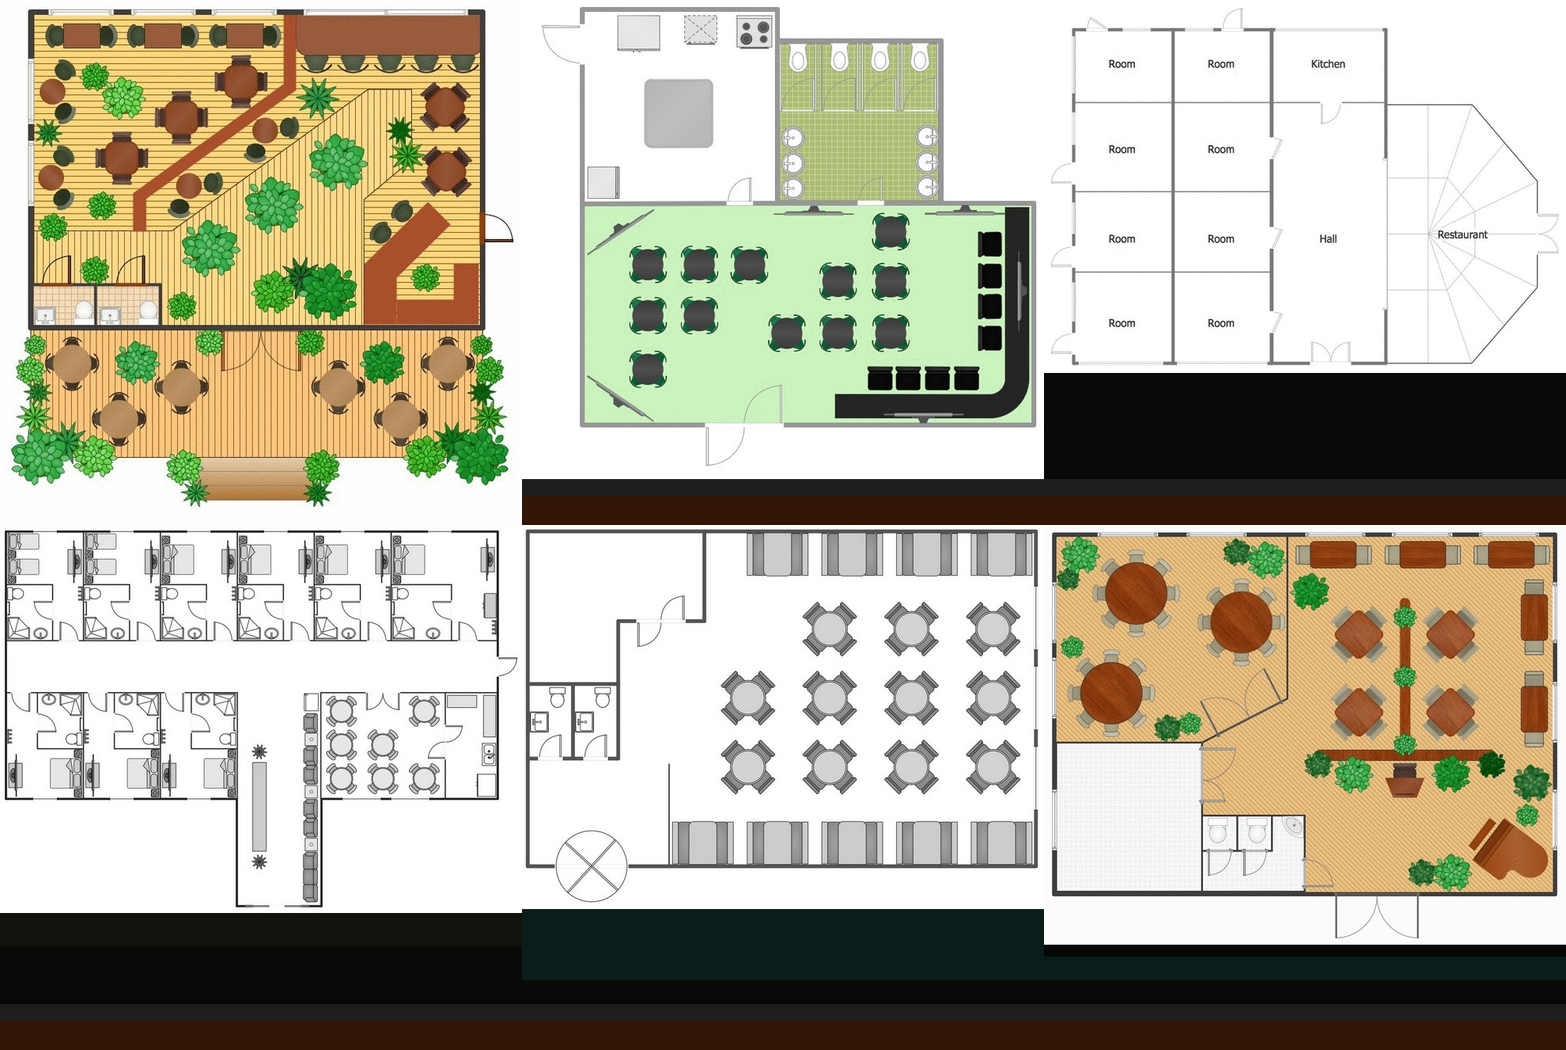
Imagine a place for socialization, comfort, relax and memories - restaurant. It is more than just food enterprise. Atmosphere and appearance of the whole restaurant and separately of each area, whether dining room, bar, waiting lounge, or restroom, are most important points. The idea behind the restaurant greatly determines materials, the flow of spaces and placement of walls. Design also should to be functional and practical to increase the staff productivity and sales. Thinking a lot about architecture, design and menu of the restaurant, don't forget about safety, ergonomy and profitability. When you planning to open a restaurant, you have create Restaurant Layout Plan, Restaurant Floor Plan, Restaurant Design Plan, Restaurant Electrical Plan, Emergency Plan, Plan of Furniture Arrangement, Landscape Design Plan. Sounds complicated? No worries, ConceptDraw DIAGRAM extended with Cafe and Restaurant Floor Plan solution contains variety of Restaurant Floor Plans samples, templates and predesigned objects which will help you in successful planning and designing your new restaurant or renovation an existing one.Diagramming Software for Design UML Object Diagrams
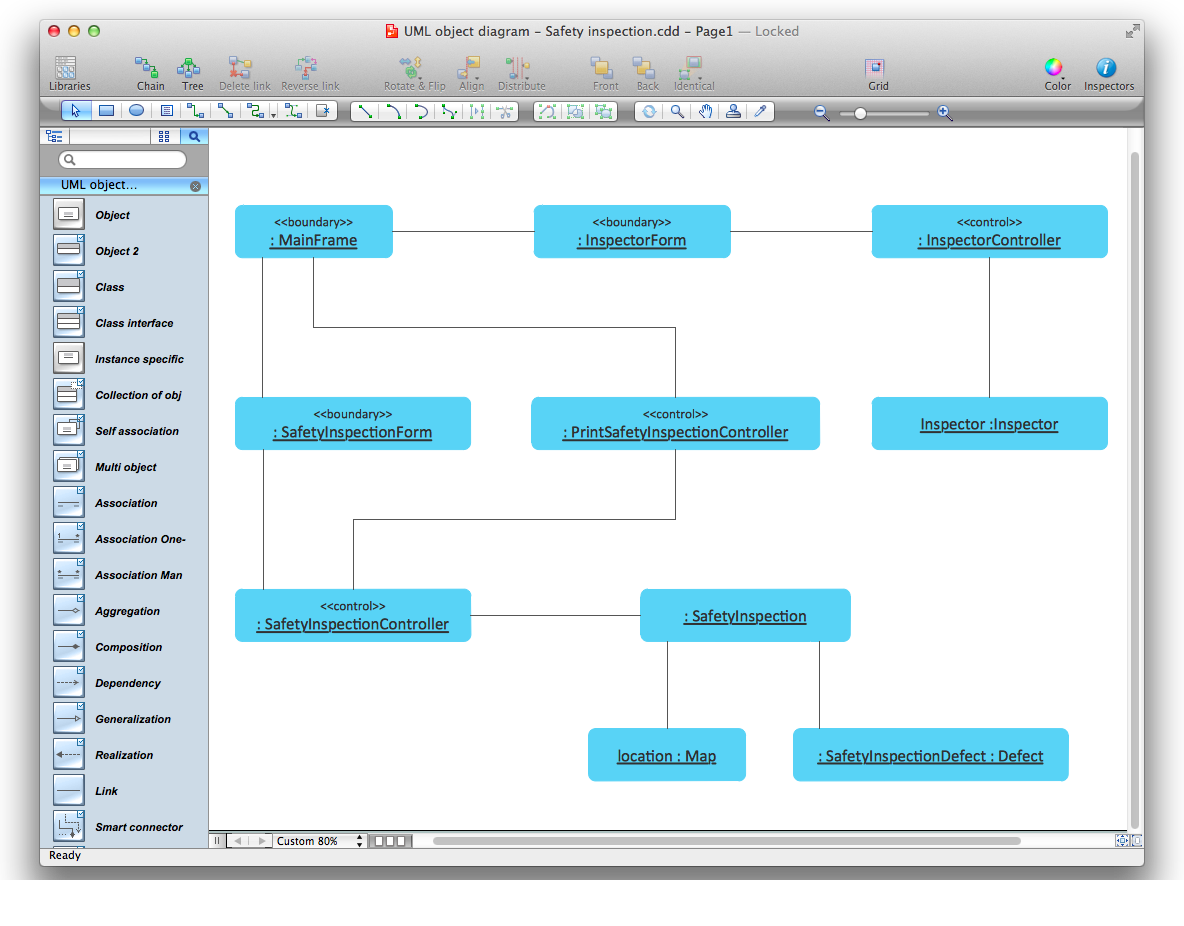
UML Object Diagram shows the structure of a modeled system at a specific time. ConceptDraw Rapid UML solution delivers libraries contain pre-designed objects fit UML notation, and ready to draw professional UML Object Diagram.
Organogram Software
Organizing process is the process of creating the organizational structure of an enterprise. The organizing process consists of several stages. First, you need to divide the organization into departments, respectively to strategies, and then establish relationships of authority. After that, managing director delegates his rights and authorities.Examples of Flowchart
This sample shows the Flowchart of the ACC general account creation. This Flowchart describes the Start point, the process of the handling the user requests and the End point – creating of the account. The shapes represent the subprocesses and the arrows between the shapes shows the sequence of the actions. This sample was created in ConceptDraw DIAGRAM diagramming and vector drawing software using the Flowcharts solution from the "Diagrams" area of ConceptDraw Solution Park.
- Best Planogram Software For Mac
- Planogram Software Free Trial For Mac
- Planogram Software Free Download
- Free Best Planogram Software
- Free Planogram Software Downloads
- Best Free Planogram Template Mac
- Free Planogram Software
- Planogram Software and Retail Plan Software | Business diagrams ...
- Free Convent Store Planogram Software Downloads


