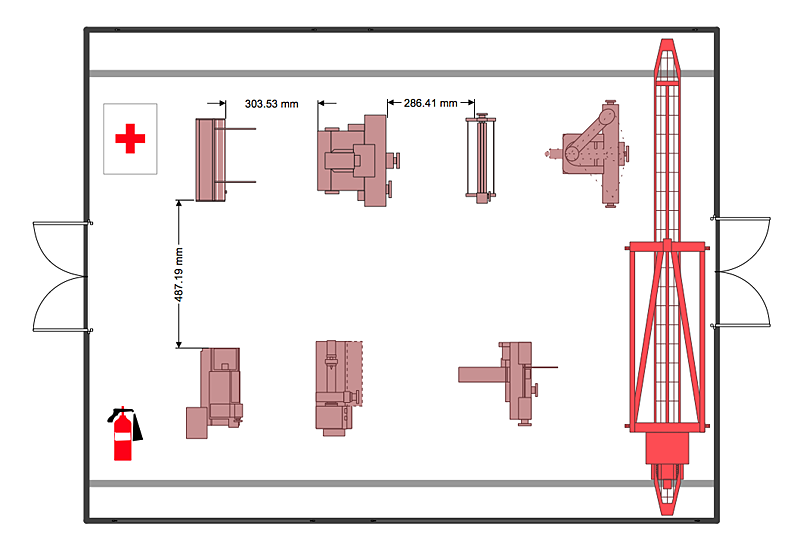
 Plant Layout Plans
This solution extends ConceptDraw PRO v.9.5 plant layout software (or later) with process plant layout and piping design samples, templates and libraries of vector stencils for drawing Plant Layout plans. Use it to develop plant layouts, power plant desig
 Workflow Diagrams
Workflow Diagrams solution extends ConceptDraw PRO software with samples, templates and vector stencils library for drawing the work process flowcharts.
 Fishbone Diagrams
The Fishbone Diagrams solution extends ConceptDraw PRO v10 software with the ability to easily draw the Fishbone Diagrams (Ishikawa Diagrams) to clearly see the cause and effect analysis and also problem solving. The vector graphic diagrams produced using this solution can be used in whitepapers, presentations, datasheets, posters, and published technical material.
HelpDesk
How to Create a Plant Layout Design
A plant construction process begins from a plant layout stage - an engineering stage used to design, analyze and finally choose the suitable configurations for a manufacturing plant. Plant Layout issues are core to any enterprise and are challenged in all types of manufacturing process. The sufficiency of layout influences the efficiency of subsequent operations. It is an important background for efficient manufacturing and also has a great deal with many questions. Once the place of the plant has been determined, the next important task before the management of the plant is to plan appropriate layout for the enterprise. Plant layout is used to create the most effective physical arrangement of machinery and equipment, with the plant building in such a manner so as to make quickest and cheapest way from a raw material to the shipment of the completed product Making a plan that shows the location of industrial equipment involves many different elements that can be managed using Con
 Manufacturing and Maintenance
Manufacturing and maintenance solution extends ConceptDraw PRO software with illustration samples, templates and vector stencils libraries with clip art of packaging systems, industrial vehicles, tools, resources and energy.
 Fishbone Diagram
Fishbone Diagrams solution extends ConceptDraw PRO software with templates, samples and library of vector stencils for drawing the Ishikawa diagrams for cause and effect analysis.
 Chemical and Process Engineering
This chemical engineering solution extends ConceptDraw PRO v.9.5 (or later) with process flow diagram symbols, samples, process diagrams templates and libraries of design elements for creating process and instrumentation diagrams, block flow diagrams (BFD
 Cross-Functional Flowcharts
Cross-functional flowcharts are powerful and useful tool for visualizing and analyzing complex business processes which requires involvement of multiple people, teams or even departments. They let clearly represent a sequence of the process steps, the order of operations, relationships between processes and responsible functional units (such as departments or positions).
Cross Functional Flowchart Examples
Take a look on an example of Cross-Functional-Flowchart, showing the software service cross-function process flowcharts among the different departments. It presents a simple flowchart among the customer, sales, technical support, tester and development. Try now Flowchart Software and Cross-Functional library with 2 libraries and 45 vector shapes of the Cross-Functional Flowcharts solution. Then you can use built-in templates to create and present your software service cross-function process flowcharts.- Process Flowchart | Plant Layout Plans | Flow chart Example ...
- Plant Layout Plans | Process Flowchart | Workflow Diagrams ...
- Plant Layout Plans | Process Flowchart | Factory layout floor plan ...
- Flowchart Plan Production Facility
- Plant Layout Plans | Onion Diagram Process Design | Process flow ...
- Flow Chart Of A Manufacturing Plant
- Factory layout floor plan | Plant Layout Plans | Flow chart Example ...
- Plant Layout Template
- Manufacturing Plant Layout Examples
- Plant Layout Plans | Process Flowchart | Office Layout Plans ...
- Plant Layout Plans | Factory layout floor plan | Store Layout Software ...
- Warehouse layout floor plan | Flow chart Example . Warehouse ...
- Flow chart Example . Warehouse Flowchart | Plant Layout Plans ...
- Plant Layout Plans | Interior Design Machines and Equipment ...
- Process Flow Chart In Machine Manufacturing Industry
- Warehouse layout floor plan | How to Create a Plant Layout Design ...
- Process Flow Chart Of Manufacturing Plant
- Process Flowchart | Process Flow Diagram Symbols | Design ...
- Manufacturing A Industrial Factory Building With An Example
- Flow chart Example . Warehouse Flowchart | Factory layout floor plan ...

