PM Presentations
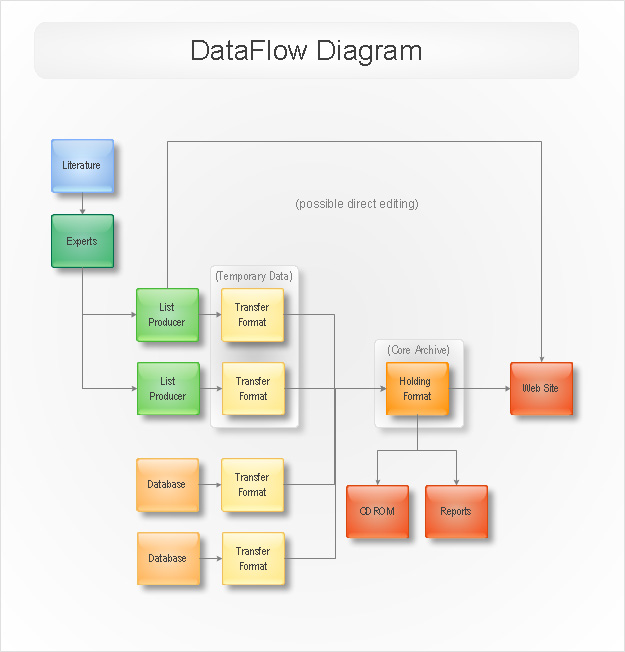
The PM Presentations solution extends the power of ConceptDraw MINDMAP , ConceptDraw DIAGRAM , and ConceptDraw PROJECT, improving their efficiency at many stages of the project management process by using the same source data to construct the targeted presentation for your audience and clearly communicating the appropriate information to different audiences from a single source. It gives an ability to project managers and other team participants to create and to deliver capacious presentations representing the data and knowledge of a specific project with the help of including visual dashboards, Gantt charts, resource views, maps, timelines, calendars, illustrations, project diagrams and reports of varied types. Having the possibility to edit collaboratively in a Full-Screen Mode, the teams can rapidly plan a project as well as execute the tasks of revising and making changes to it.
Website Wireframe
The innovative Website Wireframe solution enhances the ConceptDraw DIAGRAM functionality with newest wireframe tools, libraries with variety of predesigned icons, symbols, buttons, graphics, forms, boxes, and many other vector elements, templates and professionally designed samples, which make it the best wireframing software. Website Wireframe solution gives you significant advantages when designing and maintaining websites, creating skeletal and content-free depictions of website structure, making website prototypes and planning the content arrangement before committing to design, also speeds up the processes of sketching, producing and sharing wireframe examples of website style and interface design.
PM Mind Maps and Tables
PM Mind Maps and Tables solution extends the functional abilities of ConceptDraw DIAGRAM and ConceptDraw MINDMAP software with a set of drawing tools, professionally developed samples and templates allowing to prepare the project documentation including wide set of charts, tables, matrices, and Mind Maps. Being intended for the project manager, senior managers, team leaders and other project team members, it facilitates the execution of main project manager duties, contributes effective project planning and project management process implementation, increasing productivity in project planning, documenting, project presentation, tracking the progress and reporting.
AWS Architecture Diagrams
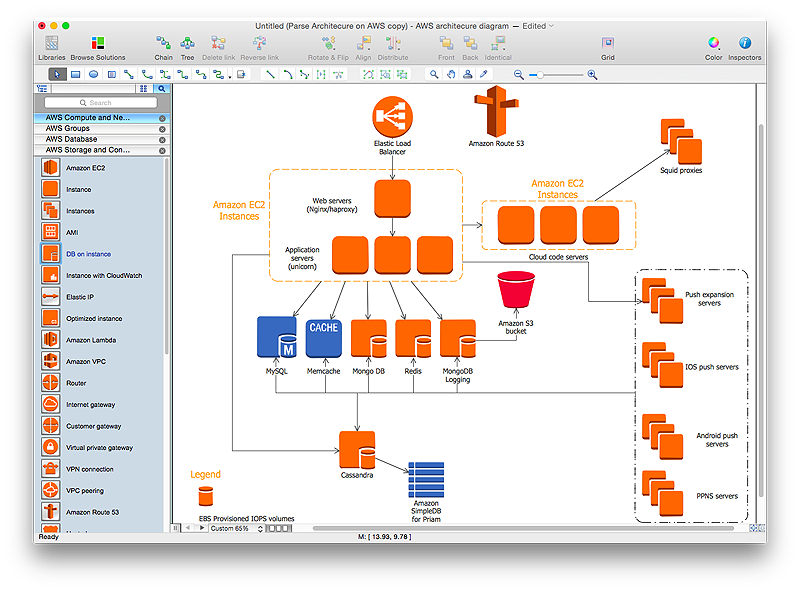
AWS Architecture Diagrams with powerful drawing tools and numerous predesigned Amazon icons and AWS simple icons is the best for creation the AWS Architecture Diagrams, describing the use of Amazon Web Services or Amazon Cloud Services, their application for development and implementation the systems running on the AWS infrastructure. The multifarious samples give you the good understanding of AWS platform, its structure, services, resources and features, wide opportunities, advantages and benefits from their use; solution’s templates are essential and helpful when designing, description and implementing the AWS infrastructure-based systems. Use them in technical documentation, advertising and marketing materials, in specifications, presentation slides, whitepapers, datasheets, posters, etc.
Internet of Things
The Internet of Things solution extends ConceptDraw DIAGRAM with a set of samples and a wide collection of predesigned special clipart, pictograms, and symbols of IoT sensors, IoT devices, smart appliances, retail, industrial, and agricultural IoT devices, and many other IoT objects. This solution is incredibly helpful for designing the Internet of Things (IoT) and Web of Things (WoT) diagrams and infographics of different complexity for numerous areas and industries. It is incredibly useful for engineers, designers, electricians, mechanics, developers, technicians, electronics, and safety-related specialists.
Computers and Communications
Computers and communications solution extends ConceptDraw DIAGRAM software with illustration samples, templates and vector stencils libraries with clip art of computers, control devices, communications, technology, Apple machines.
ConceptDraw Solution Park
ConceptDraw Solution Park collects graphic extensions, examples and learning materials
Report Presentation
A word "presentation" is often used in a modern business language. It is a systematic, ordered, vivid and imaginative presentation of something, which attracts attention of the target audience. The presentations are widely used for demonstration and attracting attention to something new, new products or services, and also rather often are applied as a way of presenting results of work and reports. With help of presentation it is possible to vividly and briefly tell and show the benefits of a given product or service, provide information about the business project to investors. The presentation for the report is an indispensable tool of communication, it is compiled from the data of the report and contains the most important theses, summary graphs, charts and other images and infographics. Design of presentation has very important value, because the information together with eye-pleasing design is perceived easier. The ConceptDraw Office suite is perfect for creation different diagrams, charts, schematics, Mind Maps, project documents, and also is ideal for easy creation reports and professional looking report presentations.Google Cloud Platform
Google Cloud Platform solution extends the ConceptDraw DIAGRAM functionality with extensive collection of drawing tools, ready-made samples and professionally designed specific Google Cloud Platform icons, allowing effectively design Google Cloud Platform (GCP) architectural diagrams, Google Cloud Platform drawings, GCP schematics of different complexity, and to illustrate on them the work of Google Cloud Platform (GCP), best features of GCP, its services, solutions and products, and the ways of their use.
Network Layout Floor Plans
Network Layout Floor Plans solution extends ConceptDraw DIAGRAM software functionality with powerful tools for quick and efficient documentation the network equipment and displaying its location on the professionally designed Network Layout Floor Plans. Never before creation of Network Layout Floor Plans, Network Communication Plans, Network Topologies Plans and Network Topology Maps was not so easy, convenient and fast as with predesigned templates, samples, examples and comprehensive set of vector design elements included to the Network Layout Floor Plans solution. All listed types of plans will be a good support for the future correct cabling and installation of network equipment.
DOM Tree
DOM Tree solution extends the functionality of ConceptDraw DIAGRAM and ConceptDraw MINDMAP software making them ideal for designing the Document Object Model, DOM hierarchy and DOM tree diagram. You are free to choose — design your DOM document object model in ConceptDraw DIAGRAM or create the DOM Tree Mind Map in ConceptDraw MINDMAP and then automatically generate it to DOM tree diagram in ConceptDraw DIAGRAM file. This solution includes a lot of samples and predesigned vector shapes, smart and direct connectors for fast and easy drawing strict, informative and professional-looking DOM model, DOM trees, DOM hierarchies, DOM document structures, and DOM Tree Mind Maps.
ConceptDraw Solution Park
ConceptDraw Solution Park collects graphic extensions, examples and learning materials
Mechanical Engineering
Mechanical Engineering solution for ConceptDraw DIAGRAM charting and drawing software is full of the pre-made examples of the mechanical drawings and stencil libraries full of the mechanical engineering-related symbols it becomes simpler to create the needed mechanical engineering drawings or assembly, parts, hydraulic and pneumatic systems’ drawings. The Mechanical Engineering solution can be useful for many mechanical engineers and other engineers and designers.
Pie Charts
Pie Charts are extensively used in statistics and business for explaining data and work results, in mass media for comparison (i.e. to visualize the percentage for the parts of one total), and in many other fields. The Pie Charts solution for ConceptDraw DIAGRAM offers powerful drawing tools, varied templates, samples, and a library of vector stencils for simple construction and design of Pie Charts, Donut Chart, and Pie Graph Worksheets.
Correlation Dashboard
Correlation Dashboard solution can be used while creating the dashboards in the ConceptDraw DIAGRAM diagramming and drawing software. This solution contains the set of the Live Objects that were designed for helping to visualize a predictive relationship between two numerical parameters of items from one or few series by using the Scatter Plot Charts.
Cloud Computing Diagrams
The Cloud Computing Diagrams solution extends the functionality of the ConceptDraw DIAGRAM diagramming software with a comprehensive collection of libraries of commonly accepted cloud computing vector stencils to help you to get started designing Cloud Computing Diagrams, Architecture Diagrams and Cloud Computing Architecture Diagrams without effort. This solution lets one professionally depict the way how the cloud computing works, allows giving a powerful introduction to the Cloud computing architecture and Amazon cloud computing architecture, to display the essence of the cloud computing, the main characteristics and classification of the cloud services thanks to the wide variety of predesigned samples and examples.
Business Diagrams
The Business Diagrams Solution extends ConceptDraw DIAGRAM with an extensive collection of professionally designed illustrative samples and a wide variety of vector stencils libraries, which are the real help for all business-related people, business analysts, business managers, business advisers, marketing experts, PR managers, knowledge workers, scientists, and other stakeholders allowing them to design the bright, neat, expressive and attractive Bubble Diagrams, Circle-Spoke Diagrams, Circular Arrows Diagrams, and Venn Diagrams with different quantity of sets in just minutes; and then successfully use them in documents, reports, statistical summaries, and presentations of any style.
Business Process Diagrams
Business Process Flow Diagrams solution extends the ConceptDraw DIAGRAM BPM software with RapidDraw interface, templates, business process diagrams examples and numerous libraries based on the BPMN 1.2 and BPMN 2.0 standards, which give you the possibility to visualize equally easy simple and complex processes, design business models, quickly develop and document in details any business processes on the stages of project’s planning and implementation.
- PM Presentations | Web Based Project Manager - Conceptdraw.com
- PM Planning | ConceptDraw Solution Park | How To Make the Right ...
- How To Create a PERT Chart Using PM Easy Solution | Making ...
- UML component diagram | PM Personal Time Management
- Computer and Networks Area | Directional Maps | PM Presentations ...
- How to Use ConceptDraw Sales Dashboard Solution | PM ...
- How to Publish Project Reports to a Web Site | What Constitutes a ...
- PM Meetings | A Tool for EffectiveTeam Meetings | Tool for ...
- HR Dashboard | PM Dashboards | Dashboard Management Software
- Reporting Dashboard Software for Business | PM Dashboards ...