DroidDia PRO unlocker
Droiddia allows you to make flow charts org charts venn diagrams mindmaps and do other diagrams with no constrains and as little effort as possible.HelpDesk
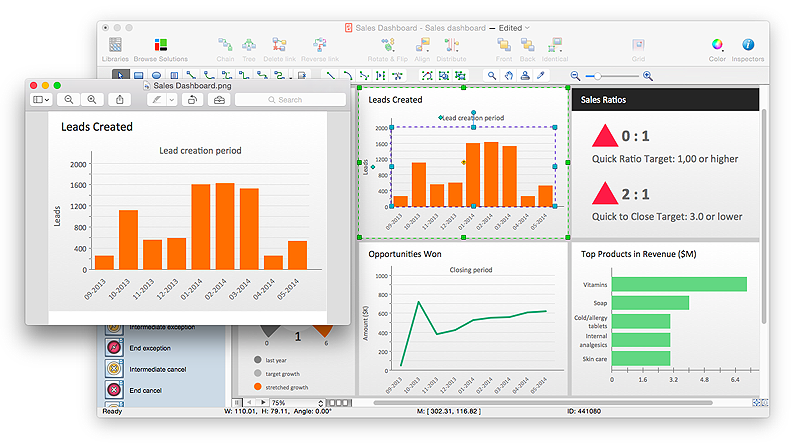
How to Save a Drawing as a Graphic File in ConceptDraw PRO
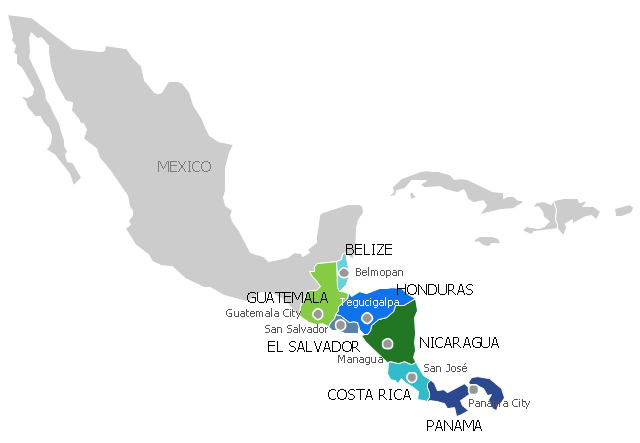
ConceptDraw PRO can save your drawings and diagrams in a number of highly useful formats, including graphic files. You can save your drawing as a .PNG, .JPG, or other graphic format file."Central America ... is the central geographic region of the Americas. It is the southernmost, isthmian portion of the North American continent, which connects with South America on the southeast. When considered part of the unified continental model, it is considered a subcontinent. Central America consists of seven countries: Belize, Costa Rica, El Salvador, Guatemala, Honduras, Nicaragua, and Panama. Central America is part of the Mesoamerican biodiversity hotspot, which extends from northern Guatemala through central Panama. It is bordered by Mexico to the north, the Caribbean Sea to the east, the North Pacific Ocean to the west, and Colombia to the south-east, which is also the most southern point of North America." [Central America. Wikipedia]
This example Political map of Central America was redesigned from Wikimedia Commons file: Map of Central America.png. [commons.wikimedia.org/ wiki/ File:Map_ of_ Central_ America.png]
This file is licensed under the Creative Commons Attribution-Share Alike 3.0 Unported license. [creativecommons.org/ licenses/ by-sa/ 3.0/ deed.en]
The example "Political map of Central America" was created using the ConceptDraw PRO diagramming and vector drawing software extended with the Continent Maps solution from the Maps area of ConceptDraw Solution Park.
This cycle process chart was redesigned from the Wikimedia Commons file: Business Feedback Loop PNG version.png.
"A business ideally is continually seeking feedback from customers: are the products helpful? are their needs being met? Constructive criticism helps marketers adjust offerings to meet customer needs."
[commons.wikimedia.org/ wiki/ File:Business_ Feedback_ Loop_ PNG_ version.png]
The cycle process diagram example "Business feedback loop" was created using the ConceptDraw PRO diagramming and vector drawing software extended with the Sales Flowcharts solution from the Marketing area of ConceptDraw Solution Park.
This is a schematic process flow diagram of the processes used in a typical oil refinery.
This process flow diagram (PFD) example was redesigned from the Wikimedia Commons file: RefineryFlow.png. [commons.wikimedia.org/ wiki/ File:RefineryFlow.png]
This file is licensed under the Creative Commons Attribution-Share Alike 3.0 Unported license. [creativecommons.org/ licenses/ by-sa/ 3.0/ deed.en]
"An oil refinery or petroleum refinery is an industrial process plant where crude oil is processed and refined into more useful products such as petroleum naphtha, gasoline, diesel fuel, asphalt base, heating oil, kerosene and liquefied petroleum gas. Oil refineries are typically large, sprawling industrial complexes with extensive piping running throughout, carrying streams of fluids between large chemical processing units. In many ways, oil refineries use much of the technology of, and can be thought of, as types of chemical plants. The crude oil feedstock has typically been processed by an oil production plant. There is usually an oil depot (tank farm) at or near an oil refinery for the storage of incoming crude oil feedstock as well as bulk liquid products.
An oil refinery is considered an essential part of the downstream side of the petroleum industry." [Oil refinery. Wikipedia]
The PFD example "Process flow diagram - Typical oil refinery" was created using the ConceptDraw PRO diagramming and vector drawing software extended with the Chemical and Process Engineering solution from the Chemical and Process Engineering area of ConceptDraw Solution Park.
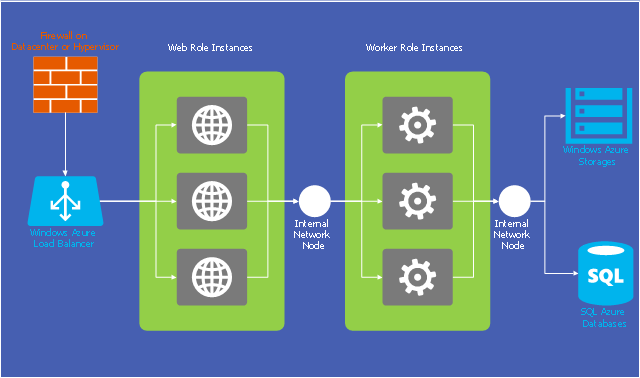
This example of cloud computing system architecture diagram was redesigned from the Wikimedia Commons file: Windows Azure Network and Computes Architecture.png. [commons.wikimedia.org/ wiki/ File:Windows_ Azure_ Network_ and_ Computes_ Architecture.png]
This file is licensed under the Creative Commons Attribution-Share Alike 2.0 license. [creativecommons.org/ licenses/ by-sa/ 2.0/ ]
"Microsoft Azure (formerly Windows Azure before 25 March 2014) is a cloud computing platform and infrastructure, created by Microsoft, for building, deploying and managing applications and services through a global network of Microsoft-managed datacenters. It provides both PaaS and IaaS services and supports many different programming languages, tools and frameworks, including both Microsoft-specific and third-party software and systems." [Microsoft Azure. Wikipedia]
The diagram example "Microsoft Azure network and computes architecture" was created using ConceptDraw PRO diagramming and vector drawing software extended with the Azure Architecture solution from the Computer and Networks area of ConceptDraw Solution Park.
A five level pyramid model of different types of Information Systems based on the information processing requirement of different levels in the organization. The first level represents transaction processing systems to process basic data. The second level represents office support systems to process information in office. The third level represents management information systems to process information by managers. The fourth level represents decision support systems to process explicit knowledge. The fifth level represents executive information systems to process tacit knowledge.
"A Computer(-Based) Information System is essentially an IS using computer technology to carry out some or all of its planned tasks. The basic components of computer based information system are:
(1) Hardware - these are the devices like the monitor, processor, printer and keyboard, all of which work together to accept, process, show data and information.
(2) Software - are the programs that allow the hardware to process the data.
(3) Databases - are the gathering of associated files or tables containing related data.
(4) Networks - are a connecting system that allows diverse computers to distribute resources.
(5) Procedures - are the commands for combining the components above to process information and produce the preferred output.
The first four components (hardware, software, database and network) make up what is known as the information technology platform. Information technology workers could then use these components to create information systems that watch over safety measures, risk and the management of data. These actions are known as information technology services." [Information systems. Wikipedia]
This pyramid diagram was redesigned using the ConceptDraw PRO diagramming and vector drawing software from Wikimedia Commons file Five-Level-Pyramid-model.png. [commons.wikimedia.org/ wiki/ File:Five-Level-Pyramid-model.png]
This file is licensed under the Creative Commons Attribution 3.0 Unported license. [creativecommons.org/ licenses/ by/ 3.0/ deed.en]
The triangle chart example "Information systems types" is included in the Pyramid Diagrams solution from the Marketing area of ConceptDraw Solution Park.
HelpDesk
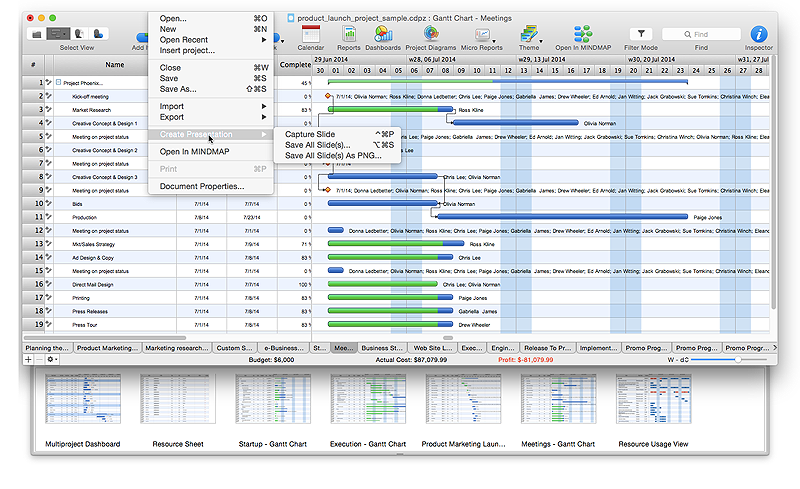
How to Get Images for Project Presentation on Macintosh
ConceptDraw PROJECT allows you to easily make slides for presentation.- Education pictograms - Vector stencils library | Bus Flat Design Png
- Wallet Images Png
- Open Exercise Book Png
- Africa Map Png
- West Africa countries | Geo Map - Asia - Papua New Guinea ...
- Reminders Png
- App icons - Vector stencils library | Iphone Nots Icon Png
- Geo Map - Asia - Papua New Guinea | Southwest Asia - Political ...
- How to Build a Flowchart | Images Of Single Ribbon Design Png
- Soccer | Offside Flag Png
- Zodiac Constellations Png
- Zodiac Star Constellations Png
- Woman Office Worker Cartoon Png
- Play Pause Volume Icons Png
- Png Soccer Player Kicking The Ball
- App icons - Vector stencils library | Ios9 Icon Png
- Fire Exit Plan. Building Plan Examples | School Door Png
- Time Vector Png High Quality
- Photography Symbols Png
- Football Player Png Image
.jpg)


-process-flow-diagram---typical-oil-refinery.png--diagram-flowchart-example.png)


