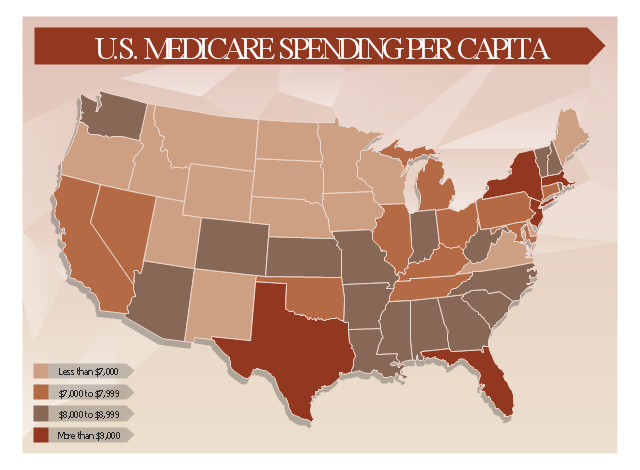
This healthcare economics infogram example was redesigned from the Wikimedia Commons file: Medicare spending per capita.png.
"Research by The Dartmouth Institute for Health Policy and Clinical Practice in the Dartmouth Atlas showed that in 2006, Medicare spending varied significantly by state. Other research quoted by the CEA Report indicated that up to 30% of Medicare costs could be saved if the middle- and high-cost states spent at the level of the lower-cost states.[1] Bear in mind that this is a Medicare comparison, so all the persons in the population analyzed are over 65.
References:
1. White House Council of Economic Advisors (CEA)-The Economic Case for Health Care Reform-June 2009-Page 19."
[commons.wikimedia.org/ wiki/ File:Medicare_ spending_ per_ capita.png]
The healthcare management thematic map sample "U.S. Medicare spending per capita" was created using the ConceptDraw PRO diagramming and vector drawing software extended with the Management Infographics solition from the area "Business Infographics" in ConceptDraw Solution Park.
DroidDia PRO unlocker
Droiddia allows you to make flow charts org charts venn diagrams mindmaps and do other diagrams with no constrains and as little effort as possible.- Management Chess Icon Png
- Employee Development Png
- HR Management Software | Human Resource Management | HR ...
- Quality System Management Png
- Management pictograms - Vector stencils library | Dollar Sign In ...
- Process Flowchart | Gant Chart in Project Management | Dashboard ...
- Human Resource Management | Human Resource Development ...
- Discipline Vector Png
- Human Resources Png
- Accounting Flowchart | Management - Design Elements | Accounting ...
- Project Management Icon Vector Png
- Quality Png Vector
- Professions - Vector stencils library | Management Consultant ...
- Customer Relationship Management Png
- Holiday | Management - Design Elements | Entity-Relationship ...
- Human Resources | Human Resource Management | Human ...
- Management indicators - Vector stencils library | Blue Gage Indicator ...
- Pyramid Diagram | Process Flowchart | Management pictograms ...
- Time Management Systems Png
- Management pictograms - Vector stencils library | Software ...

.jpg)