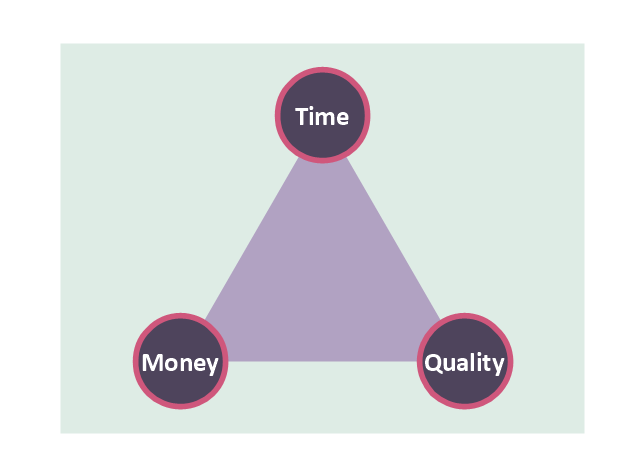
"The Time/ Money/ Quality Triangle illustrates an advertising truism, that "you can't have all three." If there is little time or money, then ad quality will suffer. The more time and/ or money that is available to the project, the higher the quality can be. However, the level of quality must be appropriate to the product...not all products should have high-quality ads!" [Advertising/ Strategies. Wikibooks]
This triangular diagram example was redesigned using the ConceptDraw PRO diagramming and vector drawing software from Wikimedia Commons file Time-Quality-Money.png. [commons.wikimedia.org/ wiki/ File:Time-Quality-Money.png]
This file is licensed under the Creative Commons Attribution-Share Alike 3.0 Unported license. [creativecommons.org/ licenses/ by-sa/ 3.0/ deed.en]
The chart sample "Time, quality, money triangle diagram" is included in the Pyramid Diagrams solution from the Marketing area of ConceptDraw Solution Park.
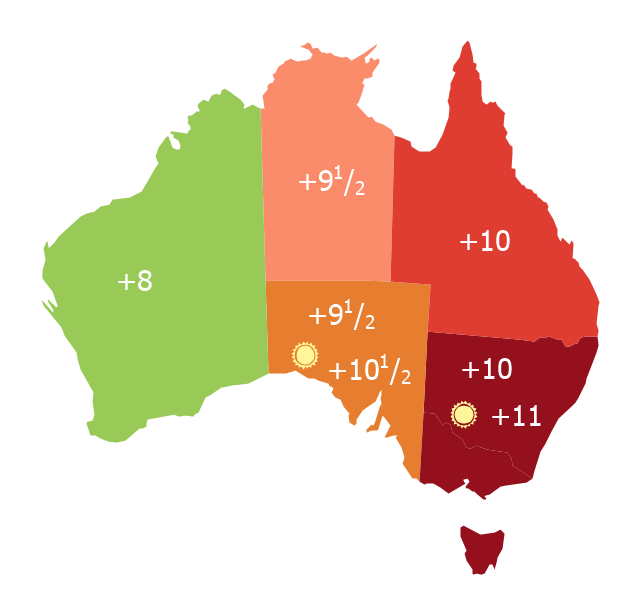
Map of Australia depicting time zones offsets from UTC by state (including daylight saving).
"Time in Australia uses more than three time zones, including Australian Western Standard Time (AWST; UTC+08:00), Australian Central Standard Time (ACST; UTC+09:30), and Australian Eastern Standard Time (AEST; UTC+10:00). Time is regulated by the individual state governments, some of which observe daylight saving time (DST). Australia's external territories observe different time zones." [Time in Australia. Wikipedia]
This thematic map was redesigned from Wikipedia file: Australia states timezones.png. [commons.wikimedia.org/ wiki/ File:Australia-states-timezones.png]
This file is licensed under the Creative Commons Attribution-Share Alike 3.0 Unported license.
[creativecommons.org/ licenses/ by-sa/ 3.0/ deed.en]
The thematic map example "Australia states time zones" was created using the ConceptDraw PRO diagramming and vector drawing software extended with the Continent Maps solution from the Maps area of ConceptDraw Solution Park.
DroidDia prime
Droiddia allows you to make flow charts org charts venn diagrams mindmaps and do other diagrams with no constrains and as little effort as possible.This interactive voice response (IVR) diagram sample shows the Scheme of VoIP call with SIM box and gateway. It was designed on the base of the Wikimedia Commons file: Scheme of VoIP call with Sim box.png. [commons.wikimedia.org/ wiki/ File:Scheme_ of_ VoIP_ call_ with_ Sim_ box.png]
This file is licensed under the Creative Commons Attribution-Share Alike 4.0 International license. [creativecommons.org/ licenses/ by-sa/ 4.0/ deed.en]
"A SIM box (also called a SIM bank) is device used as part of a VoIP gateway installation. It contains a number of SIM cards, which are linked to the gateway but housed and stored separately from it. A SIM box can have SIM cards of different mobile operators installed, permitting it to operate with several GSM gateways located in different places." [SIM box. Wikipedia]
The IVR diagram example "VoIP call with SIM box and gateway" was designed using ConceptDraw PRO diagramming and vector drawing software extended with the Interactive Voice Response Diagrams solution from the Computer and Networks area of ConceptDraw Solution Park.
This cycle process chart was redesigned from the Wikimedia Commons file: Business Feedback Loop PNG version.png.
"A business ideally is continually seeking feedback from customers: are the products helpful? are their needs being met? Constructive criticism helps marketers adjust offerings to meet customer needs."
[commons.wikimedia.org/ wiki/ File:Business_ Feedback_ Loop_ PNG_ version.png]
The cycle process diagram example "Business feedback loop" was created using the ConceptDraw PRO diagramming and vector drawing software extended with the Sales Flowcharts solution from the Marketing area of ConceptDraw Solution Park.
HelpDesk
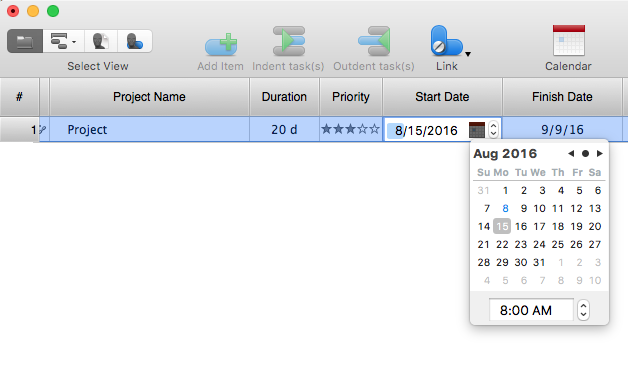
How to Operate with Project Time Frames in ConceptDraw PROJECT
ConceptDraw PROJECT applies an advanced scheduling facilities to enable you arrange your project's tasks with existing human and material resources. Comprehension of project scheduling principle allows you to plan the project the best way to execute it. Sometimes user is wondering why the task is moved to a different time than he supposed. Or he may be confused when a task's tardiness provoke the unwanted shift of other tasks. This article describes how do changes to the Start/Finish dates, or the Duration of the task affect the project schedule, created in ConceptDraw PROJECT.- Time Vector Png High Quality
- Export from ConceptDraw PRO Document to a Graphic File | Time ...
- Pyramid Diagram | Time , quality, money triangle diagram | Money ...
- Time Vector Png
- Time Symbols Png
- Time - Vector stencils library | Road signs - Vector stencils library ...
- Time and clock pictograms - Vector stencils library | Time and clock ...
- Triangle Png
- Png Series
- Pyramid Diagram | Time , quality, money triangle diagram | Pyramid ...
- Finance Clipart Png
- Basketball Court Dimensions | Stopwatch 5 Minutes Png
- Holiday Recipes | Dinner Recipes | Food Recipes | Spoon Vector Png
- Success Vector Png
- Times Pyramid Chart Triangle
- Business People Vector Png
- Australia states time zones - Thematic map | Continent Maps | Maps ...
- Png Image For Earthquake
- Working Png


.jpg)


