Polar Graph

Bar Chart Software

How To Create a FlowChart using ConceptDraw

Pie Graph Worksheets

How To Create a Bubble Chart

 Basic Floor Plans
Detailed floor plan is the basis of any building project, whether a home, office, business center, restaurant, shop store, or any other building or premise. Basic Floor Plans solution is a perfect tool to visualize your creative projects, architectural and floor plans ideas.
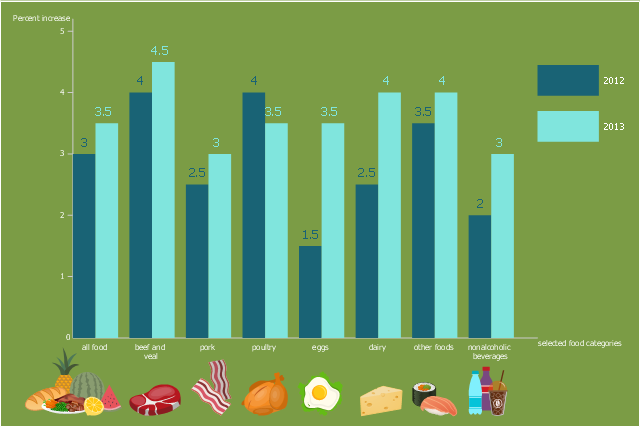
This double bar chart sample shows the forecasted impacts of 2012 drought expected to be larger in 2013 for most foods. It was designed in the base of the graph from the webpage "Price impacts of 2012 drought expected to be larger in 2013 for most foods" on the website of the United States Department of Agriculture Economic Research Service. [ers.usda.gov/ data-products/ chart-gallery/ detail.aspx?chartId=29456&ref=collection#.Ue5MMaxad5I]
"A price index (plural: “price indices” or “price indexes”) is a normalized average (typically a weighted average) of price relatives for a given class of goods or services in a given region, during a given interval of time. It is a statistic designed to help to compare how these price relatives, taken as a whole, differ between time periods or geographical locations.
Price indexes have several potential uses. For particularly broad indices, the index can be said to measure the economy's general price level or a cost of living. More narrow price indices can help producers with business plans and pricing. Sometimes, they can be useful in helping to guide investment." [Price index. Wikipedia]
The column chart example "Changes in price indices" was created using the ConceptDraw PRO diagramming and vector drawing software extended with the Bar Graphs solution from the Graphs and Charts area of ConceptDraw Solution Park.
Double bar graph
- Polar Graph | Bubble Chart Maker | Xy Graph Maker Online
- Polar Graph | Bubble Chart Maker | Online X Y Graph Maker
- Polar Graph | Physics Diagrams | Bar Chart Software | Math Graph ...
- Schedule pie chart - Daily action plan | Stakeholder Mapping Tool ...
- Chart Maker for Presentations | Scatter Plot | Spider Chart Template ...
- Line Graph Charting Software | Polar Graph | Bar Chart Software ...
- Polar Graph | Physics Diagrams | Process Flowchart | Maths Graph ...
- Polar Bubble Chart
- Value Stream Mapping | Online Math Graph Maker
- Line Graph Charting Software | Bar Chart Software | Polar Graph ...