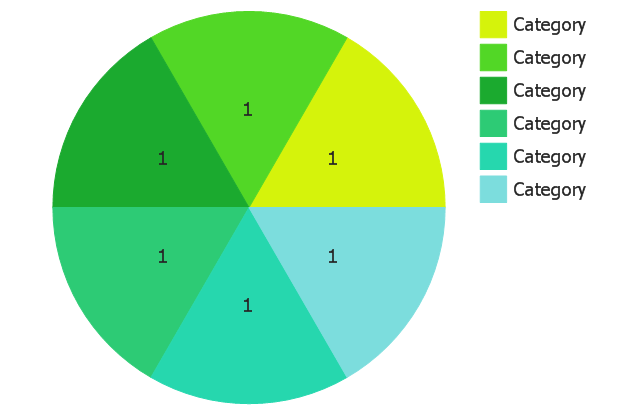
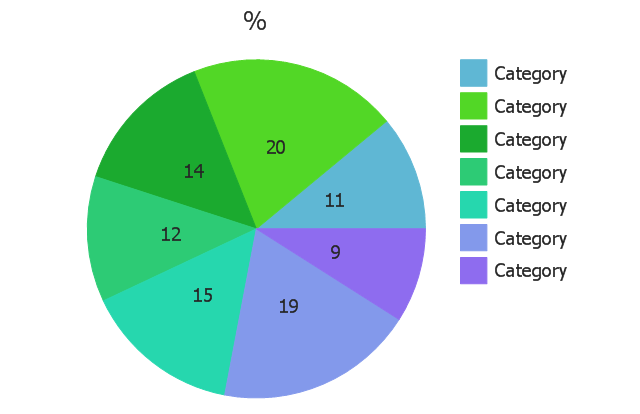
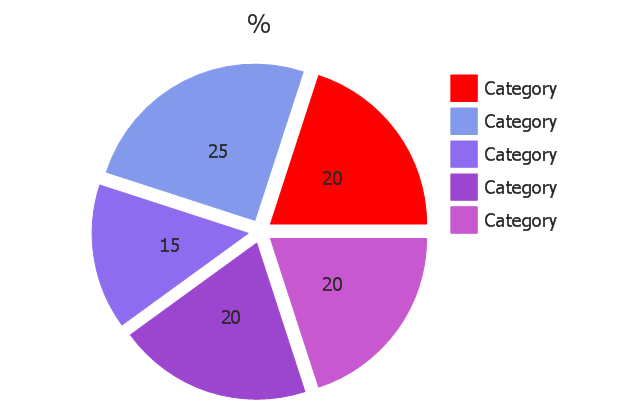
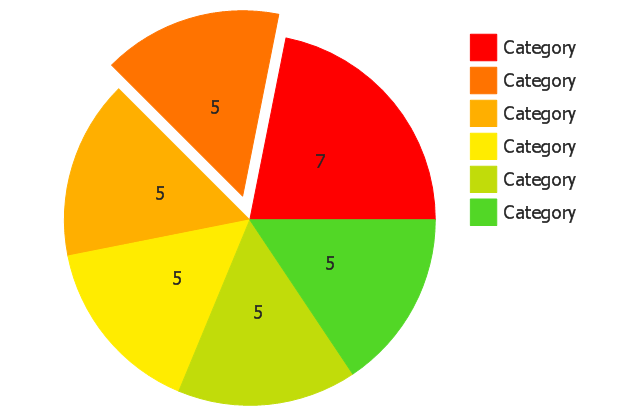
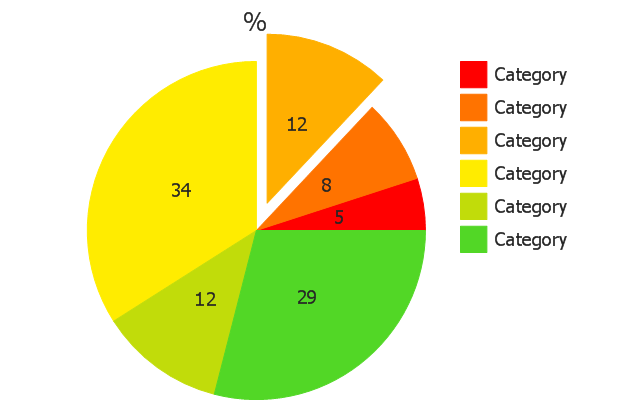
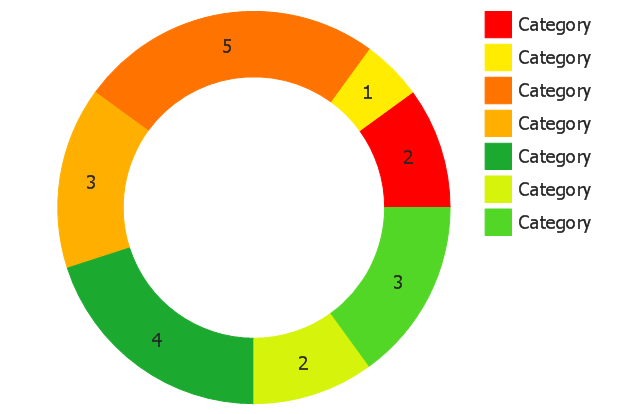
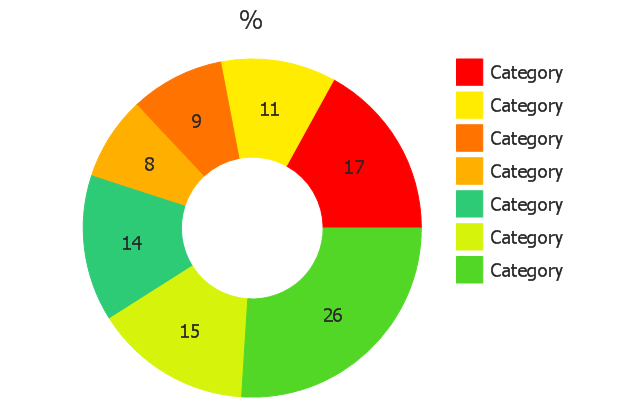
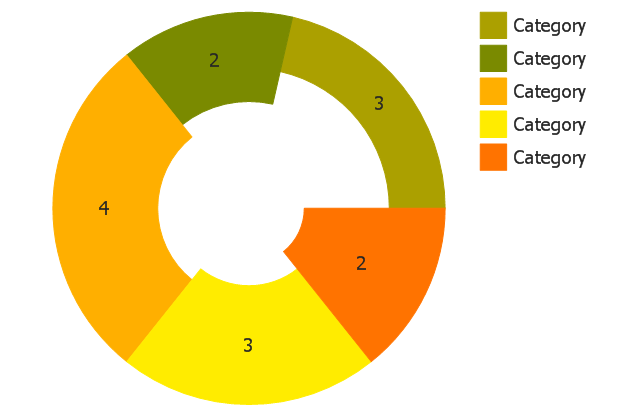
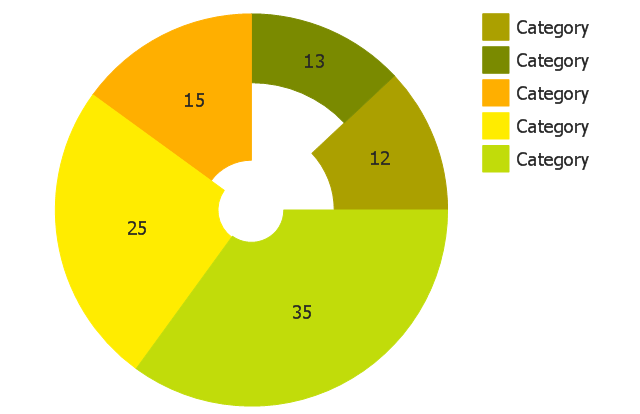
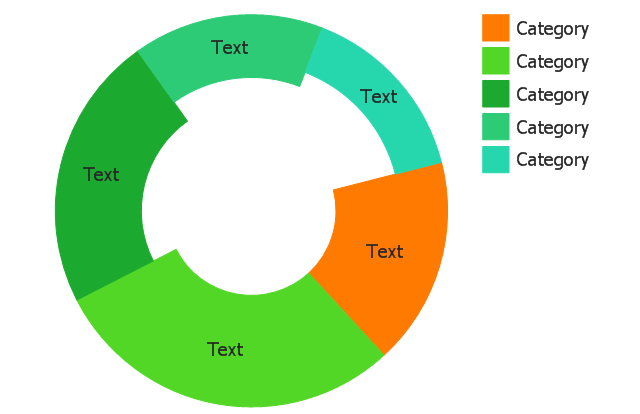
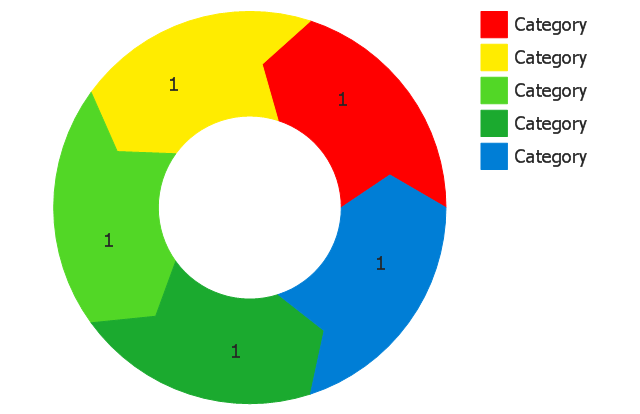
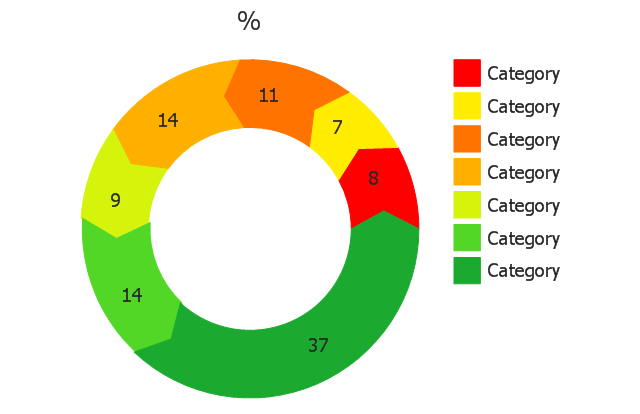
The vector stencils library "Pie charts" contains 30 templates of pie and donut (doughnut, ring) charts for visualizing percentage for parts of one total, or compare parts of few totals.
Drag a template from the library into your document and enter your data.
Use these shapes to draw your pie charts and donut charts in the ConceptDraw PRO diagramming and vector drawing software.
The vector stencils library "Pie charts" is included in the Pie Charts solution of the Graphs and Charts area in ConceptDraw Solution Park.
 Chemical and Process Engineering
Extending the ConceptDraw DIAGRAM diagramming and drawing software with process flow diagram symbols, samples, process diagrams templates and libraries of design elements for creating process and instrumentation diagrams, block flow diagrams, process flow diagrams, and piping and instrumentation diagrams for chemical and process engineering, the Chemical and Process Engineering solution can be used by both chemical and project engineers, as well as the chemists for creating the needed drawings.
 Sustainable Development
The Sustainable Development solution extends ConceptDraw DIAGRAM with a set of pre-made samples and a large collection of predesigned objects, symbols, and pictograms for designing professionally looking diagrams related to sustainable development, its processes, goals, methods, and ways for their achievement. This solution is really helpful to create schematics and designs illustrating the main points of sustainable development, social sustainability, narrating about sustainable energy and sources of green energy. It is useful to develop sustainable development plans that need to be implemented to ensure the safety of nature, list the UN sustainable development goals, draw up a plan for building a smart city and implementing the principles of sustainable agriculture, and other important information.
 Environmental, Social, and Corporate Governance
The Environmental, Social, and Corporate Governance solution with diversity of drawing tools, libraries of pre-made vector elements, and thematic samples is the best to illustrate the key points of ESG, specify ESG criteria and ESG risks. This helps investors evaluate potential investments and avoid investment losses. Outline ESG factors and ESG standards to protect the environment, avoid climate change and biodiversity loss, illustrate principles of sustainability, waste management, supply chain management, and the importance of the use of renewable energy and renewable resources. Depict easily the policies of the companies that adhere to ESG standards.
HelpDesk
How to Create a Bar Chart
Bar charts (bar graphs) are diagrams displaying data as horizontal or vertical bars of certain heights. Bar charts are widely used to show and compare the values of the same parameters for different data groups. The bar graph can be vertical or horizontal. This depends on the number of categories. There are many methods in which bar graph can be built and this makes it a very often used chart type. Usually, a bar chart is created so that the bars are placed vertically. Such an arrangement means that the bar's height value is proportional to the category value. Nevertheless, a bar chart can be also drawn horizontally. This means that the longer the bar, the bigger the category. Thus, a bar chart is a good way to present the relative values of different measured items. The ConceptDraw Bar Graphs solution allows you to draw a bar chart quickly using a vector library, containing the set of various bar charts objects.
 Internet of Things
The Internet of Things solution extends ConceptDraw DIAGRAM with a set of samples and a wide collection of predesigned special clipart, pictograms, and symbols of IoT sensors, IoT devices, smart appliances, retail, industrial, and agricultural IoT devices, and many other IoT objects. This solution is incredibly helpful for designing the Internet of Things (IoT) and Web of Things (WoT) diagrams and infographics of different complexity for numerous areas and industries. It is incredibly useful for engineers, designers, electricians, mechanics, developers, technicians, electronics, and safety-related specialists.
 Green Energy
Green Energy solution extends the ConceptDraw DIAGRAM functionality with a large collection of vector design icons, pictograms, and clipart useful to design green energy infographics and illustrations of any kind. Create overview infographics about solar power, wind power, hydropower, tidal power and other renewable and cleaner energy sources. Compare visually different types of energy or data over several years in one chart. Develop detailed infographics about power generation mechanisms, how do solar panels work, wind and tidal turbines, and more specialized power generation equipment.
- Pie charts - Vector stencils library - Ring chart | Pie Chart Of Pollution
- Percentage Pie Chart . Pie Chart Examples | Basic Pie Charts ...
- Pie Chart On Percentage Of Different Pollution
- Education Mind Maps | HVAC Plans | Pyramid Diagrams | Air ...
- Percentage Pie Chart . Pie Chart Examples | Business Report Pie ...
- Life cycle analysis - Ring chart | Pie Diagram On Environmental ...
- Life cycle analysis - Ring chart | Pie Chart Environmental Pollution
- Plant Layout Plans | Pollution Control Mindmap
- Plant Layout Plans | Using Fishbone Diagram To Solve Environment ...
- Pie Chart Examples and Templates | Pia Diagram Example
-pie-charts---vector-stencils-library.png--diagram-flowchart-example.png)
-pie-charts---vector-stencils-library.png--diagram-flowchart-example.png)
-pie-charts---vector-stencils-library.png--diagram-flowchart-example.png)
-pie-charts---vector-stencils-library.png--diagram-flowchart-example.png)
,-control-dots-pie-charts---vector-stencils-library.png--diagram-flowchart-example.png)
-pie-charts---vector-stencils-library.png--diagram-flowchart-example.png)
-pie-charts---vector-stencils-library.png--diagram-flowchart-example.png)
-pie-charts---vector-stencils-library.png--diagram-flowchart-example.png)
-pie-charts---vector-stencils-library.png--diagram-flowchart-example.png)
-pie-charts---vector-stencils-library.png--diagram-flowchart-example.png)
-pie-charts---vector-stencils-library.png--diagram-flowchart-example.png)
-2-pie-charts---vector-stencils-library.png--diagram-flowchart-example.png)
-2-pie-charts---vector-stencils-library.png--diagram-flowchart-example.png)
,-control-dots-pie-charts---vector-stencils-library.png--diagram-flowchart-example.png)
-pie-charts---vector-stencils-library.png--diagram-flowchart-example.png)
-pie-charts---vector-stencils-library.png--diagram-flowchart-example.png)
