Pyramid Diagram
Pyramid diagrams help you visualize information as a triangle divided into horizontal slices. Labelled slices represent a hierarchy. Pyramids are used in marketing presentations to show and analyze hierarchy levels. 3D triangular diagram of DIKW pyramid has 6 levels: measurement, facts, data, information, knowledge, wisdom. The data component include different scattered signs or symbols which are merely useless until these random objective facts are somehow processed. Data is a resource which has to be manipulated or rearranged to get useful. Information can be extracted from a pile of data, it also can be mined from different data storages.Pyramid Diagram
The representation of data in a hierarchical or pyramid-like form is one of the most effective and illustrative ways of structuring the data, information, ideas in different fields, among them marketing, management, business, finances, sales, consulting, media, and some others. Pyramid Diagram perfectly suits for this goal, especially if we talk about the representing some marketing strategies, information systems, social strategies. Pyramid Diagram looks like a triangle or reversed triangle that is divided visually on several layers. Each layer can be colored with its own color, this lets visually highlight important moments. ConceptDraw DIAGRAM diagramming and vector graphics software extended with Pyramid Diagrams solution from the Marketing area provides powerful drawing tools, templates, samples, and built-in vector pyramid objects, thus all required tools for equally easy drawing Three level pyramid diagram, Four level pyramid model, Five level pyramid, etc., at this your Pyramid diagrams can have 2D or 3D view as you like.Network Diagramming with ConceptDraw DIAGRAM
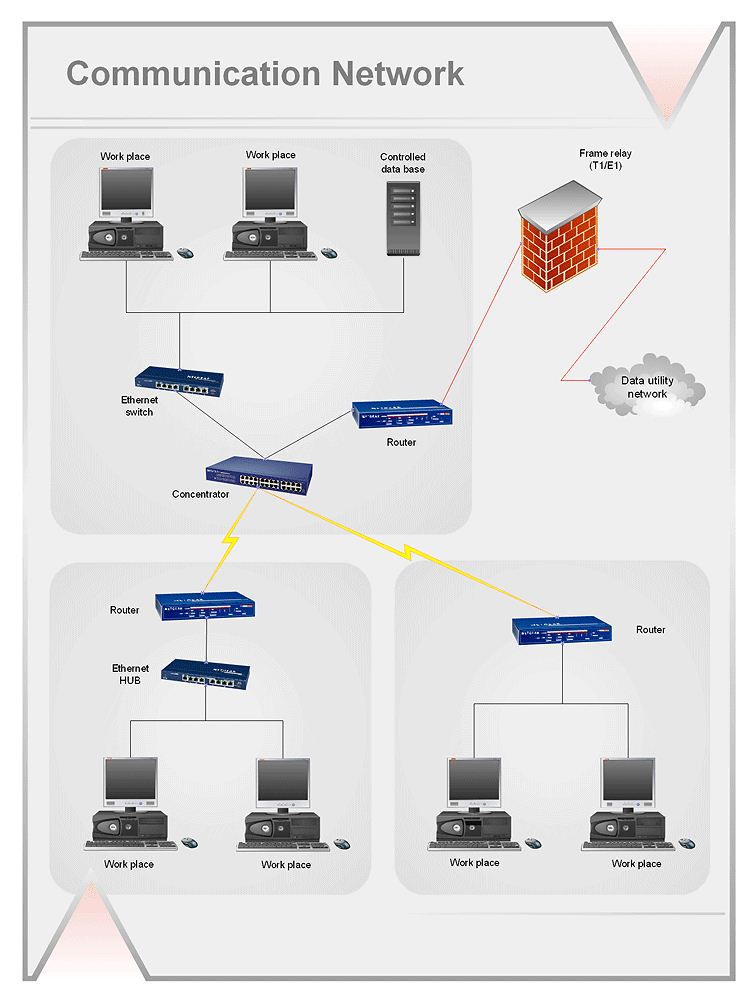
At the moment computer networks are widespread, various types of computer networks are constructed around the world, operate and interact with each other. There are many kinds of computer networks that differ in the transmission medium, in communications protocols, in size, topology, organizational intent, and also in territorial basis. There are popular such types of computer networks as Global Area Network (GAN), Wide Area Network (WAN), Metropolitan Area Network (MAN), Local Area Network (LAN). ConceptDraw DIAGRAM is a powerful network diagramming software, perfect for software engineers, software designers and software developers who need to draw Computer Network diagrams, designs, schematics, and network maps in no time. The pre-drawn shapes representing computers, network devices and smart connectors offered by ConceptDraw solutions help to create the accurate diagrams and documentation, represent computer network topologies and designs, depict Computer network architectures, logical, physical, cable networks, and vehicular networks.Pyramid Diagram
Pyramid chart example is included in the Pyramid Diagrams solution from Marketing area of ConceptDraw Solution Park.Software Flow Chart
Many professionals have to solve problems every day. Designing of the process algorithm contribute to understand where the problem is in the process. A Flowchart is a graphical tool that most usable for breaking down processes. Definition of flowchart - a diagram that shows step-by-step progression through a procedure or system especially using connecting lines and a set of conventional symbols. All the icons, symbols and connectors needed for creating standardized notation flowcharts are contained within Software Flow Chart.- Segmented pyramid diagram - Template | 6-Level 3D pyramid ...
- Pyramid Diagram | 5 Level pyramid model diagram - Information ...
- Pyramid Charts | Pyramid Diagram | Pyramid Diagram | Pyramid ...
- 4 Level pyramid model diagram - Information systems types ...
- Hierarchical Network Design
- Pyramid Diagram | Purchase funnel diagram | Pyramid Chart ...
- Pyramid Diagram | 5-level funnel diagram - Template | Purchase ...
- Sales metrics and KPIs - Visual dashboard | Website KPIs - Visual ...
- How to Draw a Hierarchical Organizational Chart with ConceptDraw ...
- Marketing Diagrams | Cloud marketing diagram | Design elements ...


