 Picture Graphs
Typically, a Picture Graph has very broad usage. They many times used successfully in marketing, management, and manufacturing. The Picture Graphs Solution extends the capabilities of ConceptDraw PRO v10 with templates, samples, and a library of professionally developed vector stencils for designing Picture Graphs.
Infographic Maker
Infographic is a visual way of representing various information, data, knowledge in statistics, geography, journalism, education, and much more areas. ConceptDraw PRO supplied with Pictorial Infographics Solution from the “What are Infographics” Area, provides a set of powerful pictorial infographics tools. Thanks to them it is the best Infographic Maker.Geo Map - Oceania
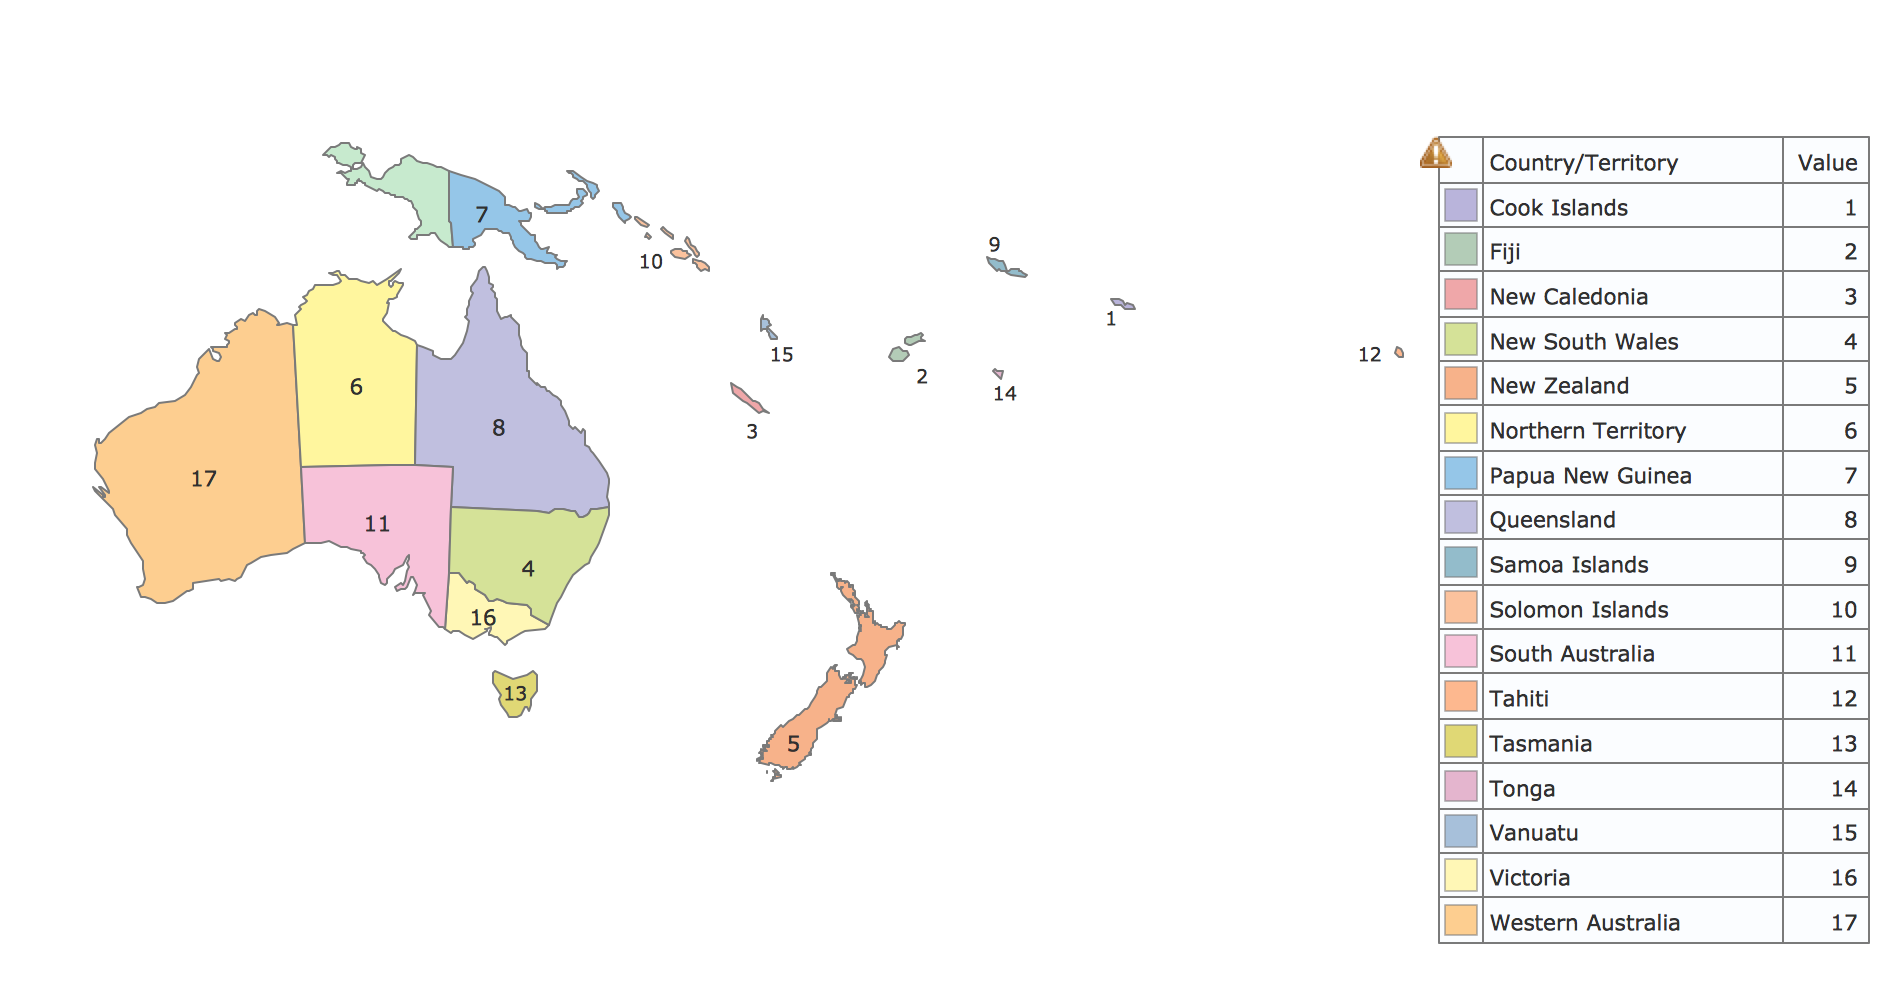
The vector stencils library Oceania contains contours for ConceptDraw PRO diagramming and vector drawing software.Visual Presentations Made Easy with Diagramming Software
Automatically create a presentation-quality diagram in one click with ConceptDraw PRO.
Pictorial Chart
You want design Pictorial Chart or Infographic? And you need powerful infographic software? Then ConceptDraw PRO diagramming and vector drawing software extended with Pictorial Infographics Solution from the “What are Infographics” Area is exactly what you need.Sample Pictorial Chart. Sample Infographics
Sample Pictorial Chart - Pictorial Infographics solution provides easy-to-use design infographics drawing tools, large collection of different sample infographics and infograms, sample pictorial chart and templates to be filled in, and 10 libraries with great quantity of predesigned vector pictograms. Use Pictorial Infographics solution to draw your own design pictorial infographics documents quick and easy.
 Basic Area Charts
This solution extends the capabilities of ConceptDraw PRO v10.3.0 (or later) with templates, samples and a library of vector stencils for drawing Area Charts (area graphs) that visualize changes in values by filling in the area beneath the line connecting data points.
 USA Maps
Use the USA Maps solution to create a map of USA, a US interstate map, printable US maps, US maps with cities and US maps with capitals. Create a complete USA states map.
Line Chart Template for Word
This sample was created in ConceptDraw PRO diagramming and vector drawing software using the Line Graphs Solution from Graphs and Charts area of ConceptDraw Solution Park. This sample shows the Line Chart of annual percentage change. The Line Chart allows you to clearly see the changes of data over the time.
 Pie Charts
Pie Charts are extensively used in statistics and business for explaining data and work results, in mass media for comparison (i.e. to visualize the percentage for the parts of one total), and in many other fields. The Pie Charts solution for ConceptDraw PRO v10 offers powerful drawing tools, varied templates, samples, and a library of vector stencils for simple construction and design of Pie Charts, Donut Chart, and Pie Graph Worksheets.
HelpDesk
How to Customize the Default Map Theme
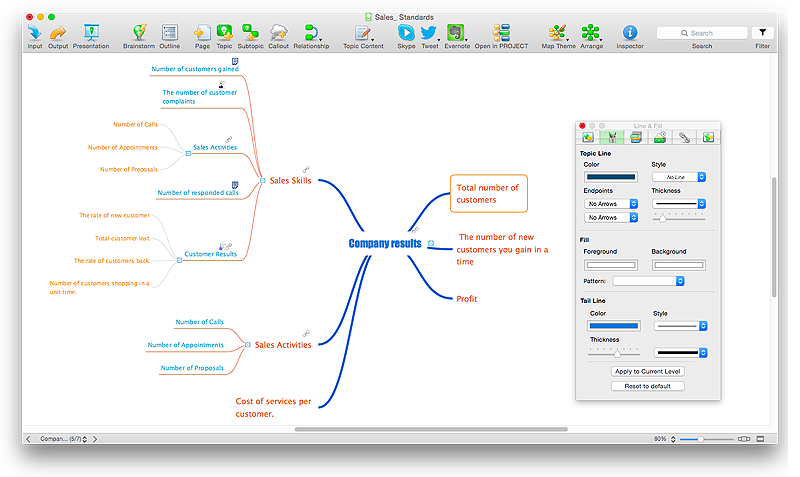
ConceptDraw MINDMAP allows you to customize all kinds of visual aspects of your mind maps, including the the style of topic lines of the default theme for new maps.Sales Plan
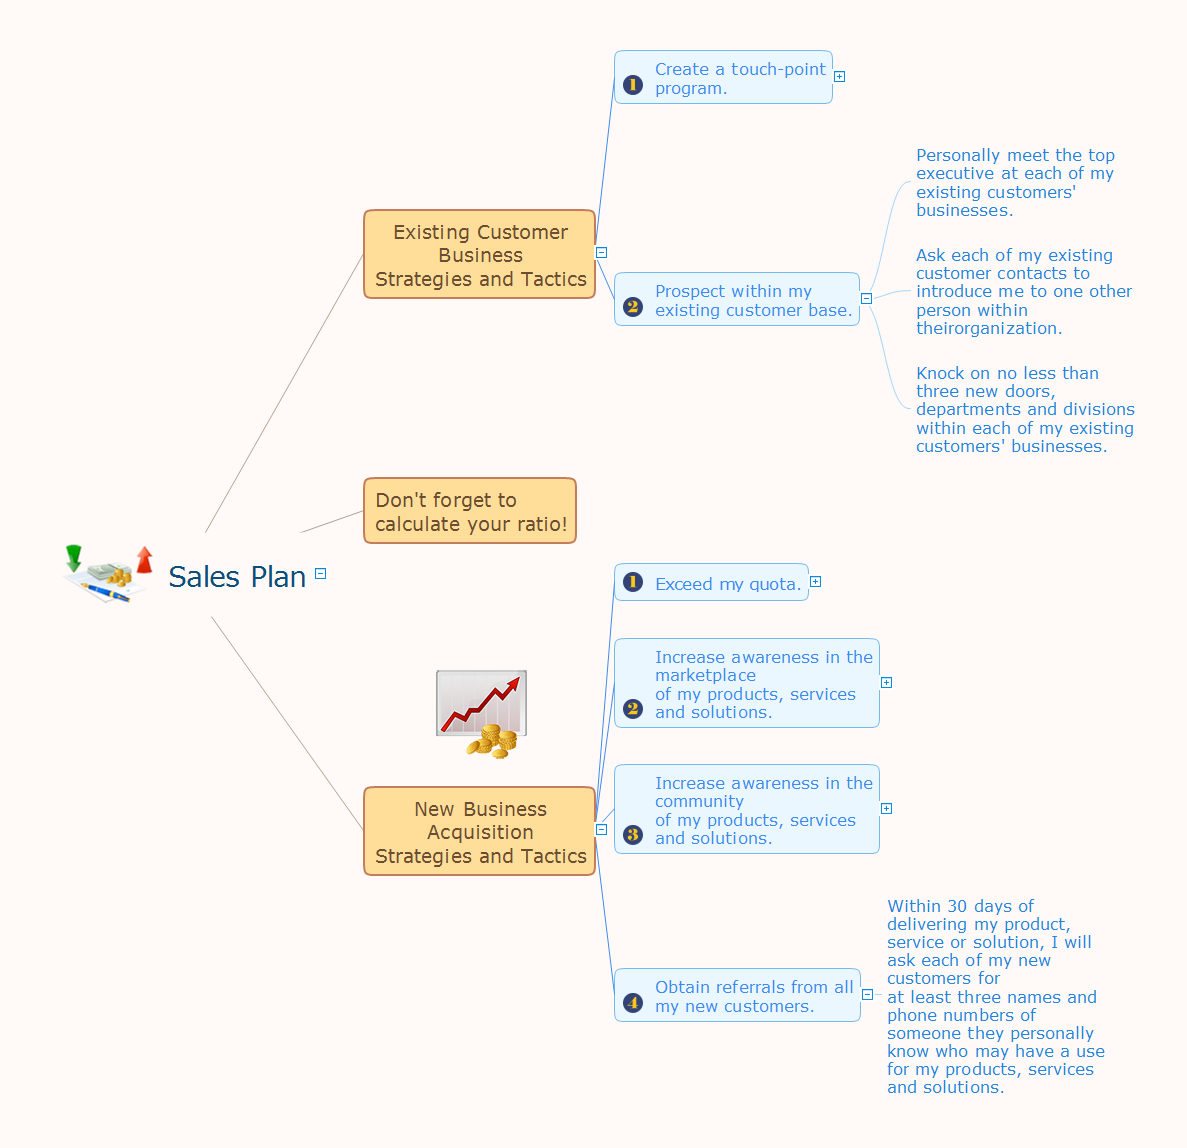
Mind map that organizes targets and goals of a sales plan.- Population Education Pictures Chart Making
- Draw Image Of Population Education
- Area Charts | Circle-Spoke Diagrams | Picture Graphs | Population ...
- Geo Map - Oceania | Line Chart Template for Word | Population ...
- Population Education Pictures
- Concept Maps | Education | What are Infographic Area | Vector ...
- Image Draw Population
- Rainfall Bar Chart | Regional population growth from 2010 to 2016 ...
- Picture Graphs | Graphs and Charts Area | Population growth by ...
- Pictures of Graphs | Picture Graph | Basic Diagramming | Pouliton ...
- Pictures of Vegetables | Pictures of Graphs | Food Pictures | Pict ...
- Population Control Through Flow Chart
- Picture Graph | Line Graph | Infographic Maker | Population Control ...
- Example Of Chart Diagram Of Showing World Population
- Line Chart Examples | Pictures of Graphs | Types of Flowchart ...
- Barrie population - Picture bar graph | Picture graphs - Vector ...
- Diagram Relstes To Population Control
- Design elements - Picture bar graphs | Picture graphs - Vector ...
- Pictures of Graphs | Food Pictures | Pictures of Vegetables | Pict ...


