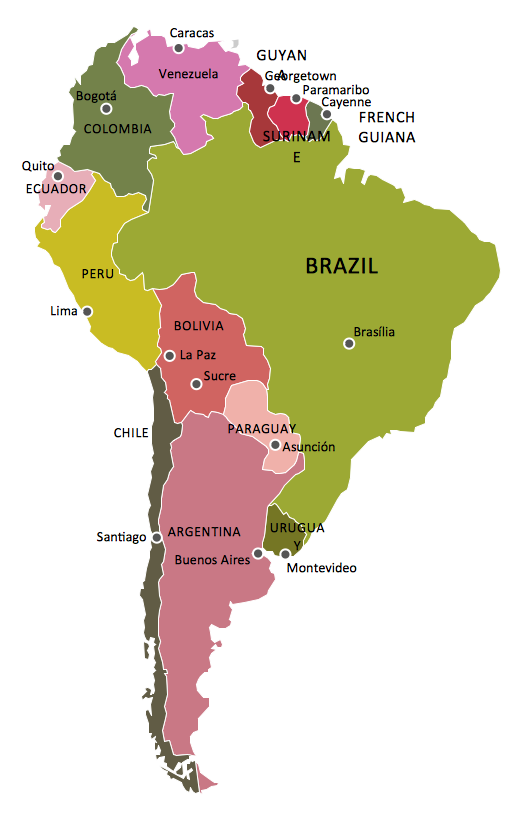
Geo Map — South America Continent
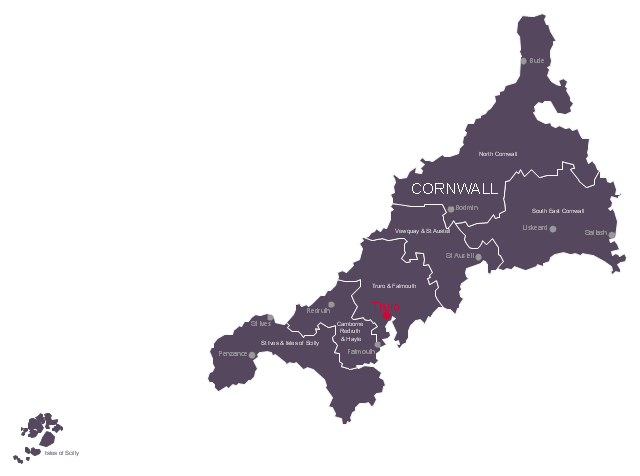
This political map example shows the six UK parliamentary constituencies of Cornwall, the capital city Truro and main towns.
"Cornwall is a peninsula bordered to the north and west by the Celtic Sea, to the south by the English Channel, and to the east by the county of Devon, over the River Tamar. ...
The administrative centre, and only city in Cornwall, is Truro, although the town of St Austell has the largest population. ...
Following a review by the Boundary Commission for England taking effect at the 2010 general election, Cornwall is divided into six county constituencies to elect MPs to the House of Commons of the United Kingdom." [Cornwall. Wikipedia]
The political map example "Cornwall parliamentary constituencies map" was drawn using ConceptDraw PRO software extended with the Map of UK solution from the Maps area of ConceptDraw Solution Park.
Sketch map of the parliamentary contituencies
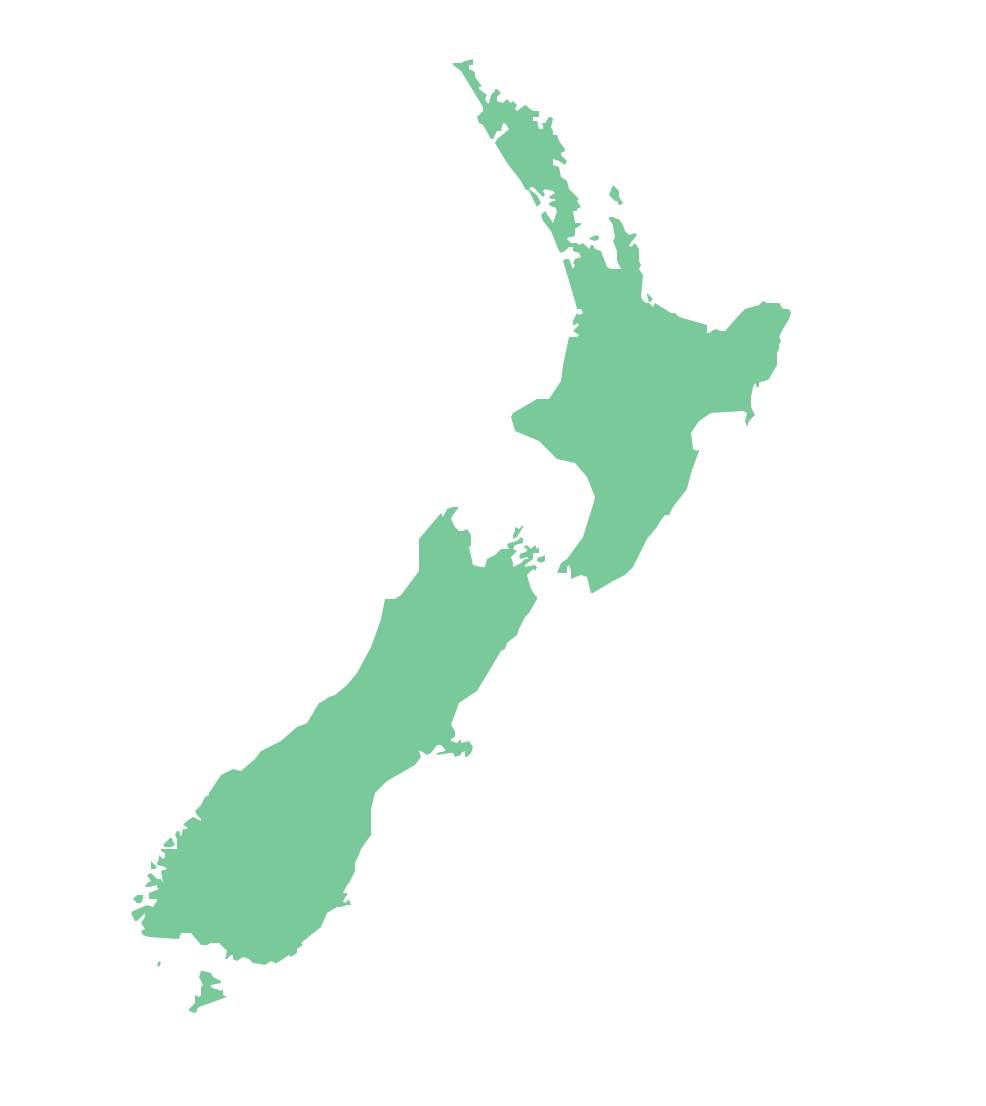
Geo Map — Australia — New Zealand
ERD Symbols and Meanings


Flow Chart for Olympic Sports

How to Draw Pictorial Chart. How to Use Infograms

Sales Process Flowchart Symbols

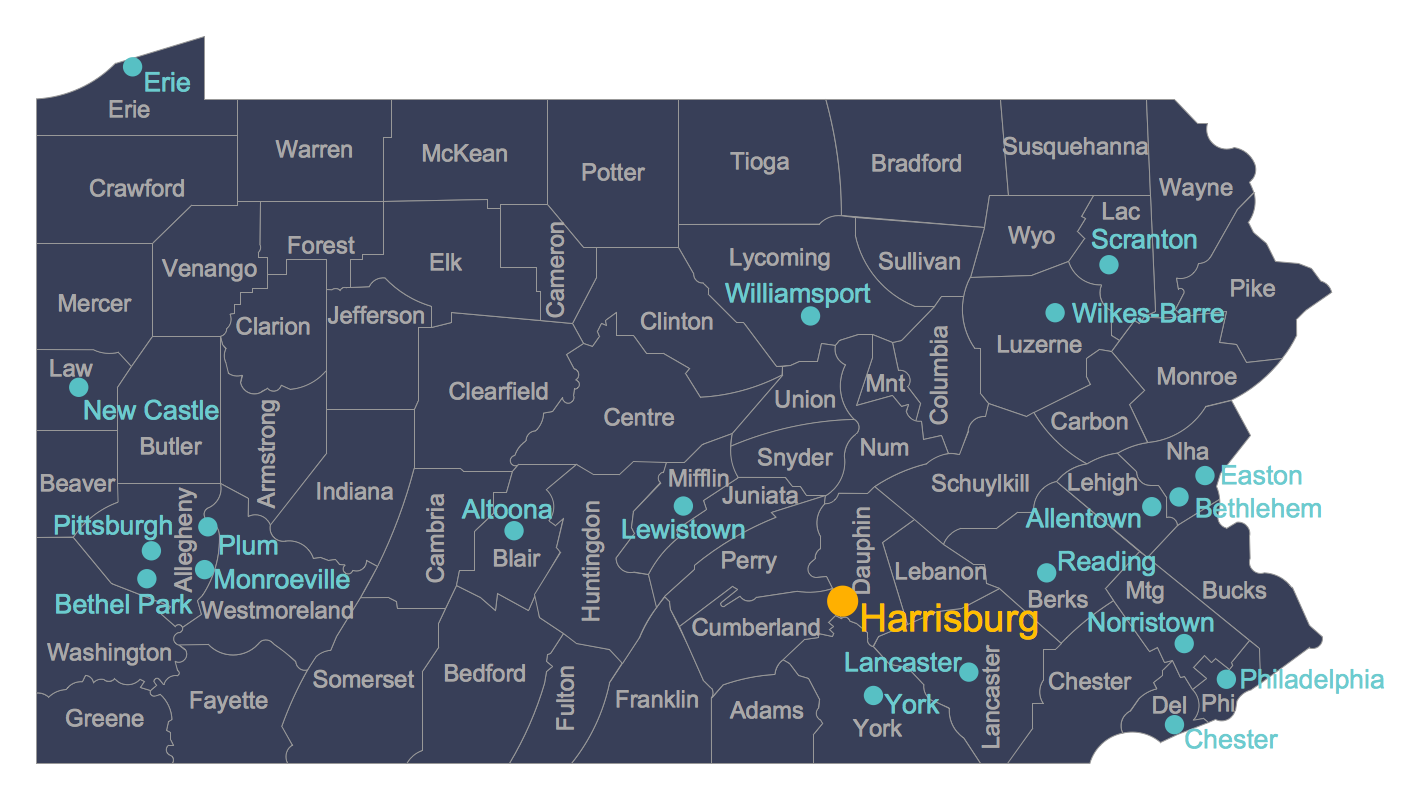
Map of USA
- Barrie population - Picture bar graph | Design elements - Picture bar ...
- Design elements - Picture bar graphs | Barrie population - Picture ...
- Picture Graphs | Regional population growth from 2010 to 2016 ...
- Picture graphs - Vector stencils library | Design elements - Picture ...
- Picture Graphs | Regional population growth from 2010 to 2016 ...
- Picture Graph
- Picture Graph Or Pictograph
- Picture Graphs | Graphs and Charts Area | Population growth by ...
- How to Create a Picture Graph in ConceptDraw PRO | Design ...
- Bar Graphs | Sales Growth. Bar Graphs Example | Bar Diagrams for ...
- Line Chart Examples | Line Graph | What Is a Line Chart | Evolution
- Design elements - Picture graphs | Picture Graphs | Resident ...
- How to Draw a Pictorial Chart in ConceptDraw PRO | How to Draw ...
- Picture graph - Template
- Picture graphs - Vector stencils library | Picture Graphs | Design ...
- Gold Graphs Sketches And Photographs
- Picture graphs - Vector stencils library | Design elements - Picture ...
- Design elements - Picture bar graphs | Bar Chart | Pictures of ...
- Appropriate Sketches Graphs Of Gold
- Graphs And Sketches Of Metropolitan Area