This site uses cookies. By continuing to browse the ConceptDraw site you are agreeing to our Use of Site Cookies.

How to Make Audio and Video Connections

Use the ConceptDraw DIAGRAM software that has vector clipart of numerous cable connectors, examples, and templates for drawing different types of audio and video connection diagrams. Paste icon of the receiver or another device to page and layout sockets and plugs. Further connect plugs with each other, and now you have well-designed connection diagram.

State Machine Diagram

UML state machine's goal is to overcome the main limitations of traditional finite-state machines while retaining their main benefits. ConceptDraw is ideal for software designers and software developers who need to draw UML State Machine Diagrams.

Security Plans

No security system cannot be constructed without detailed security plan, or even a set of plans in some cases. ConceptDraw DIAGRAM software offers the Security and Access Plans Solution from the Building Plans Area to help you design the Security Plans for any premises and of any complexity.

Marketing Organization Chart

You need design the Marketing Organization Chart and look for effective software? Now it's incredibly easy to do this in ConceptDraw DIAGRAM which was supplied with Marketing Diagrams Solution from the Marketing Area of ConceptDraw Solution Park.

Cisco networking, Cisco network Cisco Networking

Cisco networking, Cisco network
Cisco Networking solution extends the ConceptDraw DIAGRAM software functionality with properties of network diagramming and network modeling software. Solution provides the multifarious samples and large quantity of libraries with incredibly huge amount of complex predesigned vector design elements of standardized Cisco devices and equipment, such as CISCO servers, Cisco switches, Cisco Fabric Interconnects, Cisco Gateways, Access Servers, Cisco Optical NCS 1000, Cisco Optical NCS 2000, Cisco Optical NCS 4000, and Cisco Optical NCS 4200 devices, Cisco Physical Security, Cisco Service Exchange, Cisco Storage Networking, Cisco Unified Communications, Cisco Video, Cisco Wireless, and Cisco Application Networking Services equipment.

network topology diagram software, network icons, network diagram template, networking icons available, how to draw a network diagram Computer Network Diagrams

network topology diagram software, network icons, network diagram template, networking icons available, how to draw a network diagram
Computer Network Diagrams solution extends ConceptDraw DIAGRAM software with samples, templates and libraries of vector icons and objects of computer network devices and network components to help you create professional-looking Computer Network Diagrams, to plan simple home networks and complex computer network configurations for large buildings, to represent their schemes in a comprehensible graphical view, to document computer networks configurations, to depict the interactions between network's components, the used protocols and topologies, to represent physical and logical network structures, to compare visually different topologies and to depict their combinations, to represent in details the network structure with help of schemes, to study and analyze the network configurations, to communicate effectively to engineers, stakeholders and end-users, to track network working and troubleshoot, if necessary.

Flow chart Example
Warehouse Flowchart

Warehouse Flowcharts are various diagrams that describe the warehousing and inventory management processes on the warehouses. Typical purposes of Warehouse Flowcharts are evaluating warehouse performance, measuring efficiency of customer service and organizational performance. This type of Workflow diagrams can be used for identifying any disconnection between business activities and business objectives. They are effectively used by warehouse-related people and organizations, manufacturers, wholesalers, exporters, importers, transporters, and others. Standard Warehousing process flow diagram and standard Workflow diagram are used for process identification for further evaluating effectiveness and profitability of overall business process. Use the ConceptDraw DIAGRAM ector graphic software extended with Flowcharts solution to design your own professional-looking Workflow diagrams and Flowcharts of any types, including the Warehouse flowchart, Process flow diagrams which depict in details all steps of Warehouse packages flow. Microsoft Visio, designed for Windows users, can’t be opened directly on Mac. But fortunately, there are several Visio alternatives for Mac which will help Mac users to work Visio files. With ConceptDraw DIAGRAM , you may open, edit and save files in Visio format.
ConceptDraw Arrows10 Technology

Organizational Chart

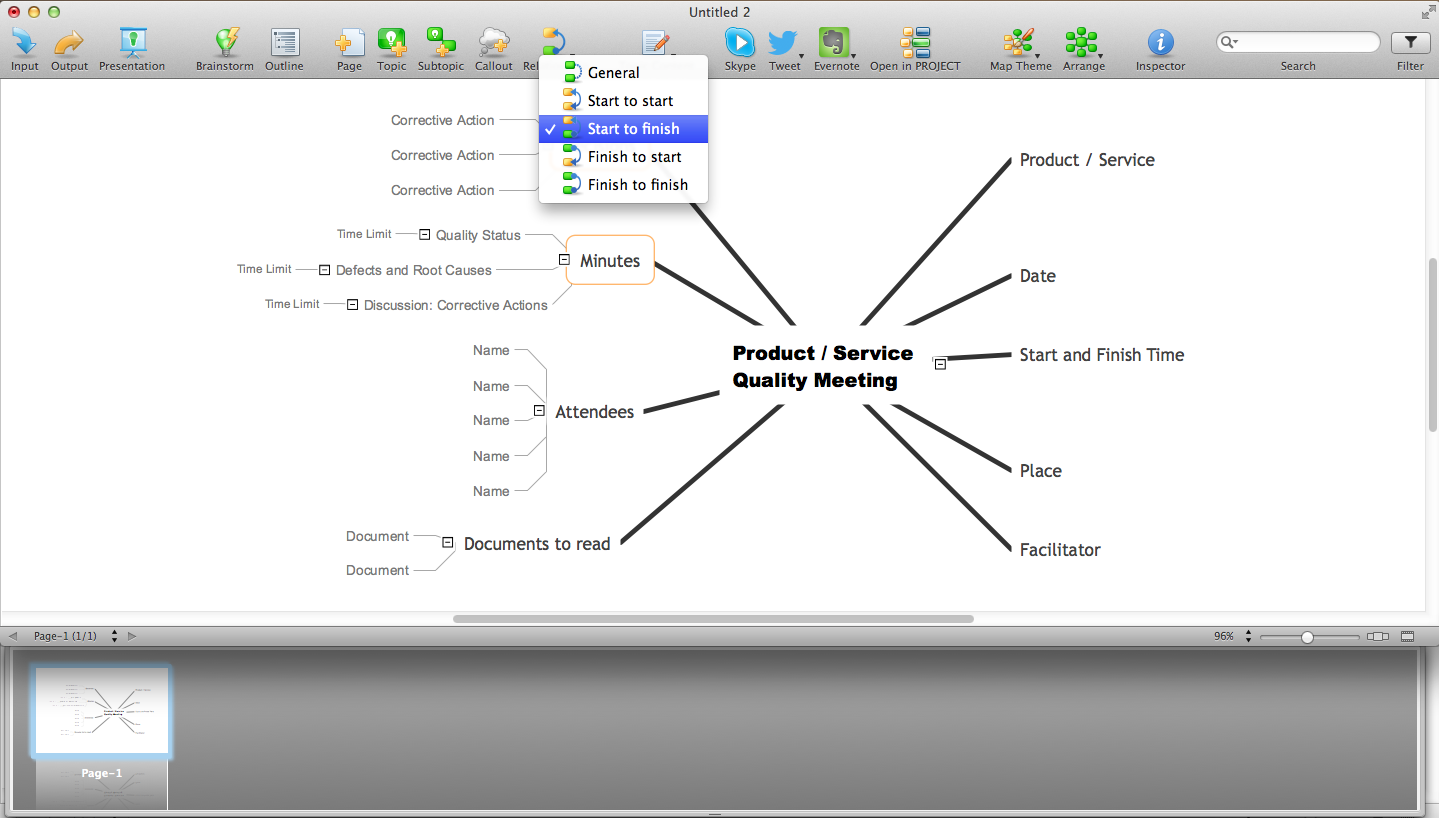
Organizational Chart is useful and perspective tool, which helps to illustrate the structure of an organization and relationships between personnel or departments. It is simple, but at the same time capacious graphical representation. ConceptDraw MINDMAP software is powerful in questions of brainstorming, designing Mind Maps and Organizational Charts, making professional presentations, building effective strategies, preparing documents and conducting meetings. ConceptDraw Office applications allow create Organizational Chart from your map in one click. Use numerous advantages of hierarchical tree structure of Mind Map when developing the organizational structure of your organization. Pay also attention on helpful Business Productivity solutions supported by ConceptDraw Solution Park, which assist managers and knowledge workers in making their jobs easier and save their time. The flexibility of ConceptDraw Office and the use of content that has already been developed and offered by ConceptDraw Solution Park as well as ability to repurpose it according to your requirements, help you effectively respond to any eventuality.
The vector stencils library "Cisco switches and hubs" contains 26 symbols of Cisco switches and hubs for drawing computer network diagrams.
"A switch is a device used on a computer network to physically connect devices together. Multiple cables can be connected to a switch to enable networked devices to communicate with each other. Switches manage the flow of data across a network by only transmitting a received message to the device for which the message was intended. Each networked device connected to a switch can be identified using a MAC address, allowing the switch to regulate the flow of traffic. This maximises security and efficiency of the network. Because of these features, a switch is often considered more "intelligent" than a network hub. Hubs neither provide security, or identification of connected devices. This means that messages have to be transmitted out of every port of the hub, greatly degrading the efficiency of the network." [Network switch. Wikipedia]
"An Ethernet hub, active hub, network hub, repeater hub, multiport repeater or hub is a device for connecting multiple Ethernet devices together and making them act as a single network segment. It has multiple input/ output (I/ O) ports, in which a signal introduced at the input of any port appears at the output of every port except the original incoming. A hub works at the physical layer (layer 1) of the OSI model. The device is a form of multiport repeater. Repeater hubs also participate in collision detection, forwarding a jam signal to all ports if it detects a collision." [Ethernet hub. Wikipedia]
The symbols example "Cisco switches and hubs - Vector stencils library" was created using the ConceptDraw PRO diagramming and vector drawing software extended with the Cisco Network Diagrams solution from the Computer and Networks area of ConceptDraw Solution Park.
www.conceptdraw.com/ solution-park/ computer-networks-cisco
Cisco hub
Cisco hub, Cisco hub,
100BaseT hub
100BaseT hub, 100BaseT hub,
Small hub
Small hub, small hub,
Workgroup switch
Workgroup switch, workgroup switch,
Workgroup switch, subdued
Workgroup switch, subdued, workgroup switch,
Voice-enabled workgroup switch
Voice-enabled workgroup switch, voice-enabled workgroup switch, voice switch,
ATM switch
ATM switch, ATM switch,
LAN2LAN switch
LAN2LAN switch, LAN2LAN switch,
ISDN switch
ISDN switch, ISDN switch,
MGX 8000 multiservice switch
MGX 8000 multiservice switch, MGX 8000 multi service switch,
Multilayer switch with Si
Multilayer switch with Si, multilayer switch with Si,
Multilayer switch
Multilayer switch, multilayer switch, layer 3 switch,
Multilayer switch with Si, subdued
Multilayer switch with Si, subdued, multilayer switch with Si,
Program switch
Program switch, program switch,
Data center switch
Data center switch, data center switch, service module,
Voice-enabled ATM switch
Voice-enabled ATM switch, voice-enabled ATM switch,
IP DSL switch
IP DSL switch, IP DSL switch,
Content switch
Content switch, content switch,
Content service switch 1100
Content service switch 1100, content service switch 1100,
Virtual layer switch
Virtual layer switch, virtual layer switch,
Layer 2 remote switch
Layer 2 remote switch, layer 2 remote switch,
Server switch
Server switch, server switch,
Multilayer remote switch
Multilayer remote switch, multilayer remote switch,
Multifabric server switch
Multifabric server switch, multifabric server switch,
Access gateway
Access gateway, access gateway,
Long-Reach CPE
Long-Reach CPE, long reach CPE,

Org Chart Diagram

ConceptDraw Office products and PM solutions included to ConceptDraw Solution Park support many project methodologies, among them Agile and Simple Projects, which help in implementing the best practices in project management. ConceptDraw Office applications give effective support in solving the issues related with planning, tracking, events, milestones, resource usage, and many other project management functions. ConceptDraw MINDMAP software provides the great advantages of a Mind Map hierarchical tree structure during the process of development the organizational structure of an organization. When you need to make the Organizational Chart, you can use any ConceptDraw DIAGRAM or ConceptDraw MINDMAP software. If you already have a designed Mind Map, it is incredibly easy to generate an Organizational Chart directly from ConceptDraw MINDMAP. You need simply double-click the corresponding icon, all the rest will be made automatically. The Organizational Chart will be created from the active page of your map, outputted to ConceptDraw DIAGRAM and opened in Slideshow mode.

Internal Audit Process

Internal auditing is an independent, objective assurance and consulting activity designed to add value and improve an organization's operations. ConceptDraw DIAGRAM diagramming and vector drawing software extended with Audit Flowcharts solution from the Finance and Accounting area perfectly suits for the Internal Audit Process. You can make sure this right now!

UML Diagramming Software

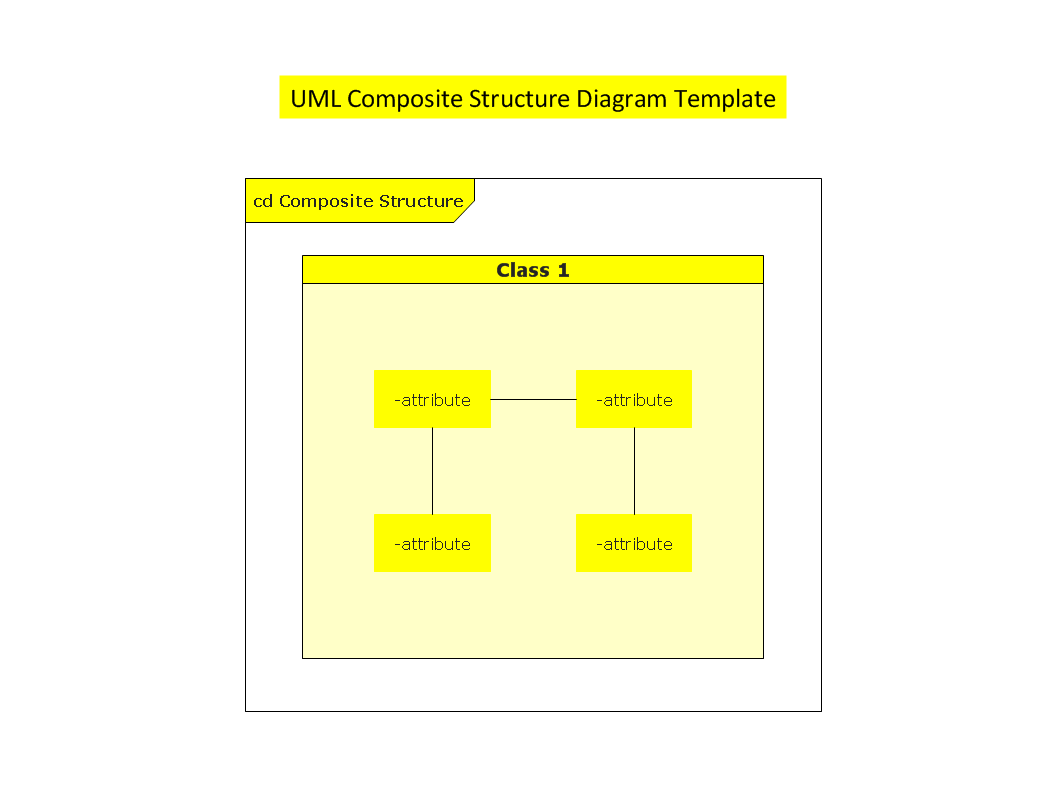
The UML Diagrams are widely used by software developers and software engineers. They can draw the UML Diagrams manually on the paper, but it is incredibly convenient to use the special UML diagramming software. The UML diagramming software allows you to draw the UML Diagrams in a few minutes.

How To Create Project Report

ConceptDraw PROJECT contains an extensive tool set to help project managers. The rich data visualization capability that is provided by ConceptDraw products helps you create project dashboards, one-click reports, multi-project views, Gantt charts, and resource views. Let′s learn how to get maximum value using ConceptDraw PROJECT!

Flow Map

A Flow Map is a type of thinking maps which help easy organize and understand information. It consists of the set of boxes and arrows, and visually displays a sequence of events. ConceptDraw DIAGRAM diagramming and vector drawing software extended with Flowcharts Solution from the "Diagrams" Area of ConceptDraw Solution Park allows you to draw in a few minutes the Flow Map of any degree of complexity.

Why People Select ConceptDraw MINDMAP

Why people select ConceptDraw MINDMAP ? Undoubtedly it is the best alternative to MindJet MindManager. Among the advantages of ConceptDraw MINDMAP are: powerful and unique tools for brainstorming, outlining, taking notes, making detailed Mind Maps and relationship maps; the personal license that gives the ownership on the product for the product's life and allows a concurrent Mac and Windows installation; the absence of obligatory subscription on renewal; regularly updates with new features, templates and low upgrade costs; free technical support and better service for a lower cost. Besides, ConceptDraw MINDMAP provides the operating system migration and compatibility with other ConceptDraw products. It is a cross-platform software for the use on Mac and Windows machines simultaneously according to your preferences. The opening of ConceptDraw MINDMAP document in ConceptDraw PROJECT application turns the outline into a project, now you can add resources and due dates, edit the tasks to make a robust and easily-deciphered project. Discover today what these benefits mean to you.

Model Based Systems Engineering

ConceptDraw DIAGRAM is a professional diagramming and vector drawing software. Now, enhanced with SysML Solution from the Software Development Area of ConceptDraw Solution Park, ConceptDraw DIAGRAM became an ideal software for model based systems engineering (MBSE).

Flow Chart Symbols

The Flowcharts are incredibly useful and popular tool used in science, business, software development, analytics, engineering, marketing, manufacturing, administration, architecture, government, politics, and many other fields thanks to a variety of existing types of flowcharts. A Flowchart is a visual graphical representation of the process, algorithm, or the set of steps taken for problem's solution. Widely used for designing, visualizing and documenting simple and complex processes and programs, they effectively help to understand the process and to find easier the flaws if they are. Each flowchart type supposes the use of its own set of notations for drawing corresponding diagram, which includes the symbols of process, decision, data, document, data base, termination, initiation processes, processing loops, conditions, etc. It is easily design a Flowchart using the special professional flowchart maker - ConceptDraw DIAGRAM diagram software with numerous predesigned flow chart symbols grouped in libraries of Flowcharts solution from ConceptDraw Solution Park.

telecommunication networking, networking and telecommunications, telecommunications network, computer systems networking and telecommunications Telecommunication Network Diagrams

telecommunication networking, networking and telecommunications, telecommunications network, computer systems networking and telecommunications
Telecommunication Network Diagrams solution extends ConceptDraw DIAGRAM software with samples, templates, and great collection of vector stencils to help the specialists in a field of networks and telecommunications, as well as other users to create Computer systems networking and Telecommunication network diagrams for various fields, to organize the work of call centers, to design the GPRS networks and GPS navigational systems, mobile, satellite and hybrid communication networks, to construct the mobile TV networks and wireless broadband networks.

Entity Relationship Software

Entity Relationship Diagram (ERD) is a leading data modeling tool that is used to illustrate the logical structure of database, helps to organize and represent your project's data in terms of entities, attributes and relationships. To describe the database structure usually is used the ERD Chen's or Crow's Foot notation. Chen's notation supposes the representation of entities by rectangles with the entities names inside, relationships by diamonds and attributes by ovals connected with a line to exactly one entity. In Crow's Foot notation the boxes are used to depict the entities and their attributes, the lines between them - to depict relationships. ConceptDraw DIAGRAM software extended with Entity-Relationship Diagram (ERD) Solution is convenient and useful for designing the ER Diagrams, and supports the use of Chen's or Crow’s Foot notation according to your needs and desires. The ERD diagrams produced with ConceptDraw DIAGRAM Entity Relationship Diagram software can be successfully used in whitepapers, presentations, posters, datasheets, technical materials, etc.

Root Cause Tree Diagram

The Root Cause Tree Diagram is a chart that helps determine the root causes of factors that influence the problem, to represent and analyze them. This diagram is constructed separately for each high priority factor. First it is needed to identify the root causes for a factor, display their structure and then propose the possible corrective actions. But how to create Root Cause Tree Diagram with the least efforts and time? ConceptDraw MINDMAP will effectively help you in drawing MINDMAP Root Cause Tree Diagram and Root Cause Analysis Tree Diagram used for further formulation of actions. The Root Cause Tree Diagram template, which can be opened at the program from the Input tab, supplies you with a basic mind map structure for your diagram. The central idea describes briefly a problem, the main topics represent the high-level causes of a problem, their subtopics give more details about the different parts of given causes. At the last level of tree are described the potential solutions to each of detailed parts of the causes.