 Marketing
This solution extends ConceptDraw PRO v9 and ConceptDraw MINDMAP v7 with Marketing Diagrams and Mind Maps (brainstorming, preparing and holding meetings and presentations, sales calls).
 Football
The Football Solution extends ConceptDraw PRO v9.5 (or later) software with samples, templates, and libraries of vector objects for drawing football (American) diagrams, plays schemas, and illustrations. It can be used to make professional looking documen
HelpDesk
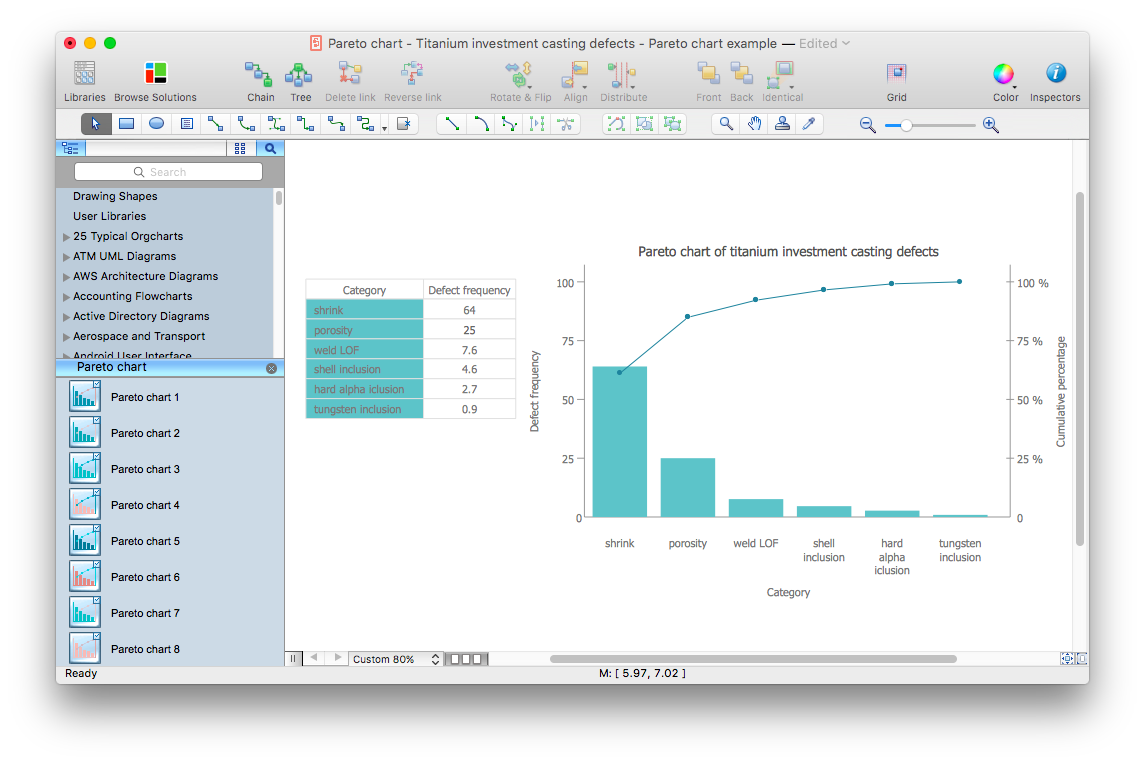
How to Draw a Pareto Chart Using ConceptDraw PRO
The Seven Basic Tools of Quality were picked as effective visual tool-set for identifying the root cause of quality-related problems within the workplace. Seven Basic Tools of Quality comprise of seven diagram that are diverse enough to be used to any business troubleshooting scenario, but simple enough that employees of all types can understand and apply them. One of these tools is a Pareto chart. It combines both a line graph and a bar chart, where the bar chart displays data values, and a line represents a total value. Pareto chart is used for quality control to identify the source of the quality problem. ConceptDraw Seven Basic Tools of Quality solution delivers a big set of vector stencil libraries and samples for each quality control diagram, including a Pareto chart.- Positioning Map | Positioning map | SWOT analysis positioning ...
- Positioning map | Business Tools Perceptual Mapping | SWOT ...
- Positioning map | Positioning Map | Business Tools Perceptual ...
- Positioning map | Competitor Analysis | Growth-Share Matrix ...
- Positioning map | Positioning Map | SWOT analysis positioning ...
- Marketing | SWOT analysis matrix diagram templates | Positioning ...
- Positioning map | Competitor Analysis | Risk Positioning Diagram ...
- SWOT analysis positioning matrix - Template | Positioning map ...
- Positioning map | Competitor Analysis | Business Tools Perceptual ...
- Brand Positioning Chart Template
- Positioning map | SWOT Analysis Solution - Strategy Tools ...
- Positioning map | Positioning Map | Swot Analysis Examples for Mac ...
- SWOT Analysis Solution - Strategy Tools | Matrices | Pyramid Chart ...
- Marketing | How to Make Soccer Position Diagram Using ...
- Positioning map | Marketing | SWOT analysis matrix diagram ...
- Positioning map | SWOT analysis matrix diagram templates ...
- Positioning Map | Mac Tools - SWOT Analysis | Infield Positioning for ...
- Positioning Map | Positioning map | Business Tools Perceptual ...
- Ansoff Matrix | Matrices | SWOT analysis matrix diagram templates ...
- Flowchart Definition | SWOT Matrix Template | Positioning Map ...
