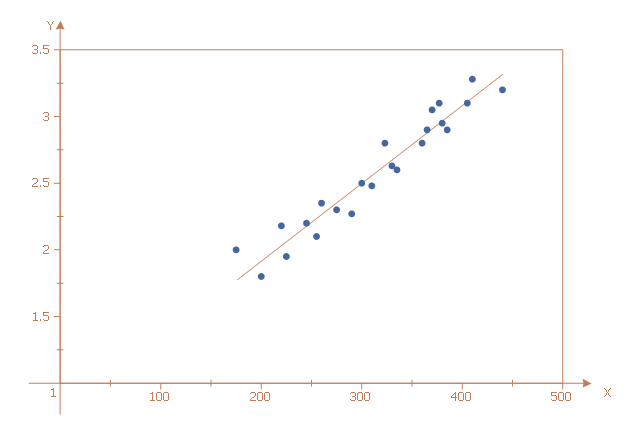
This scatter graph (scattergraph. scatter chart, scatter plot, scatterplot, scatter diagram) sample illustrates strong positive linear correlation. It was designed on the base of data from the Engineering Statistics Handbook on the website of the National Institute of Standards and Technology (NIST), the U.S. Department of Commerce.
"Note in the plot ... how a straight line comfortably fits through the data; hence a linear relationship exists. The scatter about the line is quite small, so there is a strong linear relationship. The slope of the line is positive (small values of X correspond to small values of Y; large values of X correspond to large values of Y), so there is a positive co-relation (that is, a positive correlation) between X and Y." [itl.nist.gov/ div898/ handbook/ eda/ section3/ scatter2.htm]
The scatter chart example "Strong positive linear correlation" was created using the ConceptDraw PRO diagramming and vector drawing software extended with the Scatter Diagrams solution from the Graphs and Charts area of ConceptDraw Solution Park.
 Scatter Diagrams
The Scatter Diagrams solution extends ConceptDraw DIAGRAM functionality with templates, samples, and a library of vector stencils that make construction of a Scatter Plot easy. The Scatter Chart Solution makes it easy to design attractive Scatter Diagrams used in various fields of science, work, and life activities. ConceptDraw DIAGRAM lets you enter the data to the table and construct the Scatter Plot Graph automatically according to these data.
Scatter Plot
ConceptDraw DIAGRAM extended with Scatter Diagrams solution is ideal diagramming and vector drawing software for quick and easy designing professional looking Scatter Plot.
 Computer and Networks Area
The solutions from Computer and Networks Area of ConceptDraw Solution Park collect samples, templates and vector stencils libraries for drawing computer and network diagrams, schemes and technical drawings.
 Reflected Ceiling Plans
Reflected Ceiling Plans solution extends greatly the ConceptDraw DIAGRAM functionality with samples, templates and libraries of design elements for displaying the ceiling ideas for living room, bedroom, classroom, office, shop, restaurant, and many other premises. It is an effective tool for architects, designers, builders, electricians, and other building-related people to represent their ceiling design ideas and create Reflected Ceiling plan or Reflective Ceiling plan, showing the location of light fixtures, lighting panels, drywall or t-bar ceiling patterns, HVAC grilles or diffusers that may be suspended from the ceiling. Being professional-looking and vivid, these plans perfectly reflect your ceiling ideas and can be presented to the client, in reports, in presentations, on discussions with colleagues, or successfully published in modern print or web editions.
 Rapid UML
Rapid UML solution extends ConceptDraw DIAGRAM software with templates, samples and libraries of vector stencils for quick drawing the UML diagrams using Rapid Draw technology.
 Electrical Engineering
This solution extends ConceptDraw DIAGRAM.9.5 (or later) with electrical engineering samples, electrical schematic symbols, electrical diagram symbols, templates and libraries of design elements, to help you design electrical schematics, digital and analog
 ATM UML Diagrams
The ATM UML Diagrams solution lets you create ATM solutions and UML examples. Use ConceptDraw DIAGRAM as a UML diagram creator to visualize a banking system.
- Line Chart Examples | Strong positive linear correlation | Seven ...
- Strong positive linear correlation
- 2^x Function graph | Seven Basic Tools of Quality | Line Chart ...
- How to Draw a Scatter Diagram | Scatter Plot | Scatter Plot Graph ...
- Basic Diagramming | Mathematics | Euclidean algorithm - Flowchart ...
- Scatter Graph Charting Software | Scatter Plot Graph | Scatter Chart ...
- Euclidean algorithm - Flowchart | Basic Flowchart Symbols and ...
- How To Draw Math Flow Chart
- Maths Geometrical Chart
- Scatter plot with missing categories | Scatter Diagrams | Scatter ...
- Maths Flow Chart
- Math Flow Chart Examples
- Basic Diagramming | Basic Flowchart Symbols and Meaning | Bar ...
- Solving quadratic equation algorithm - Flowchart | Diagram Flow ...
- Geometrical Chart For Maths
- Product life cycle graph | Program to Make Flow Chart | Content ...
- Euclidean algorithm - Flowchart | Solving quadratic equation ...
- Computer Flow Chart In Mathematics
- Flow Chart Mathematics Examples
- Virtuous circle (management) - Ring chart | How to Draw the ...

