Cloud Computing Architecture Diagrams
For documenting the Cloud Computing Architecture with a goal to facilitate the communication between stakeholders are successfully used the Cloud Computing Architecture diagrams. It is convenient and easy to draw various Cloud Computing Architecture diagrams in ConceptDraw DIAGRAM software with help of tools of the Cloud Computing Diagrams Solution from the Computer and Networks Area of ConceptDraw Solution Park.Sequence Diagram for Cloud Computing
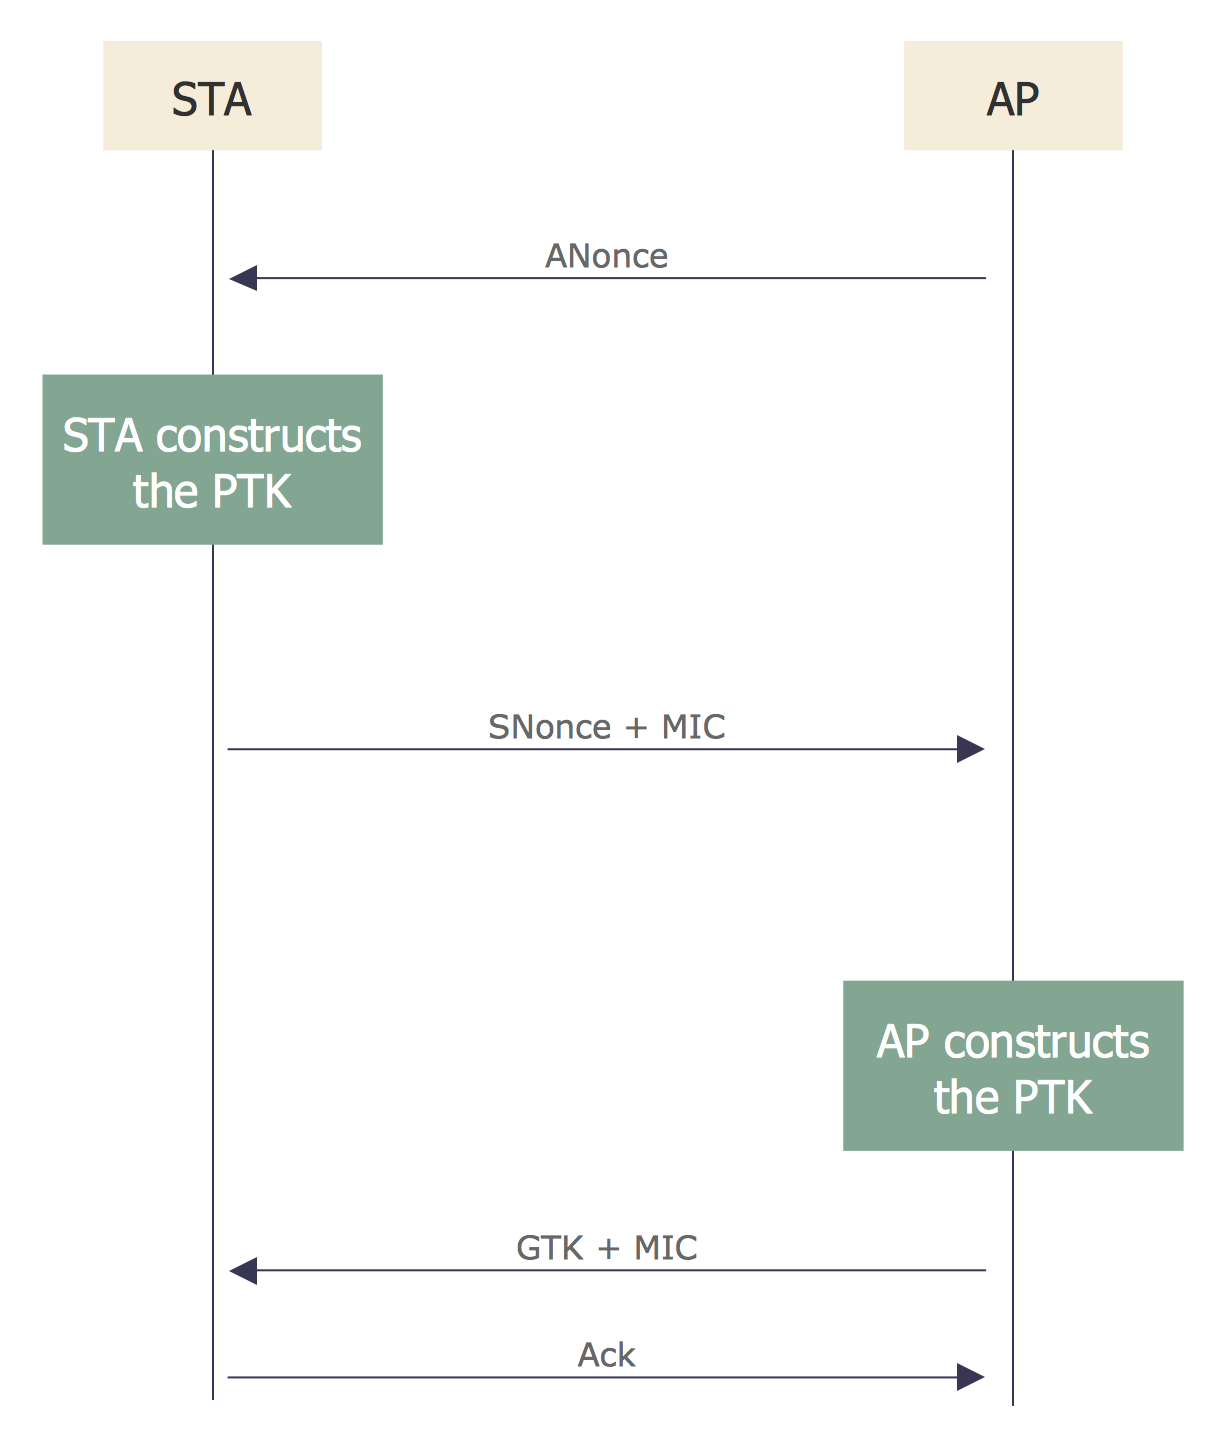
One of the ways effectively visualize what is a Cloud computing or Cloud computing architecture, is to create the Sequence diagram for Cloud computing. The ConceptDraw DIAGRAM diagramming and vector drawing software enhanced with Cloud Computing Diagrams solution from the Computers and Network area of ConceptDraw Solution Park will help you design all desired types of diagrams related with cloud computing.Create a Presentation Using a Design Template
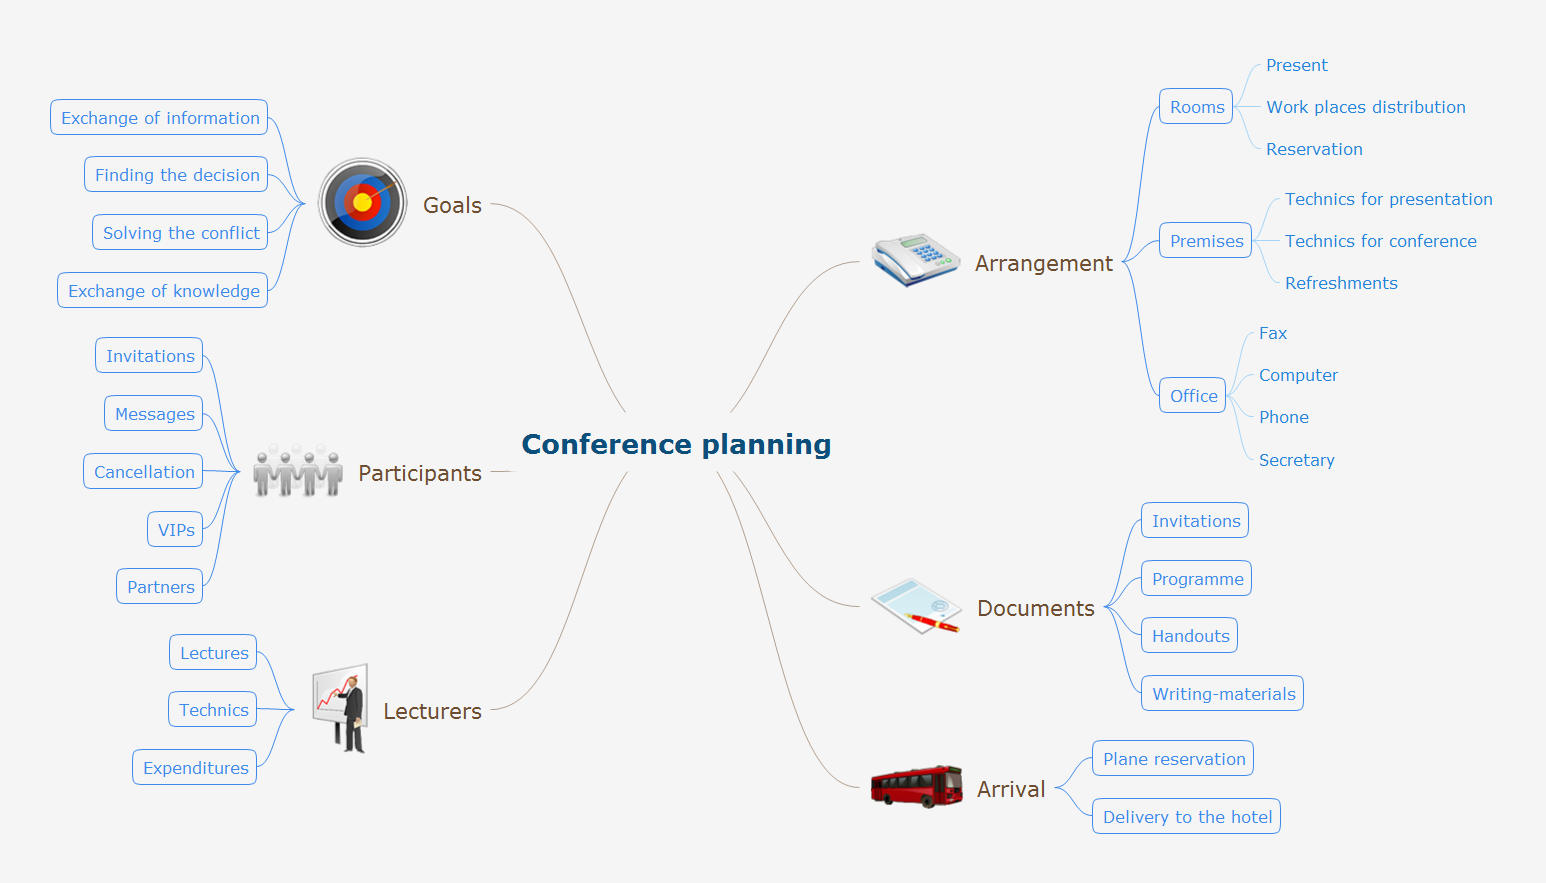
The intuitive interface of ConceptDraw MINDMAP and the Functional Tools overview below will guide you in creating and demonstrating powerful mind map presentations using template. An advanced tool allows you effectively generate, change, and update your presentation.Context Diagram Template
This template shows the Context Diagram. It was created in ConceptDraw DIAGRAM diagramming and vector drawing software using the Block Diagrams Solution from the “Diagrams” area of ConceptDraw Solution Park. The context diagram graphically identifies the system. external factors, and relations between them. It’s a high level view of the system. The context diagrams are widely used in software engineering and systems engineering for designing the systems that process the information.
Sequence Diagram Tool
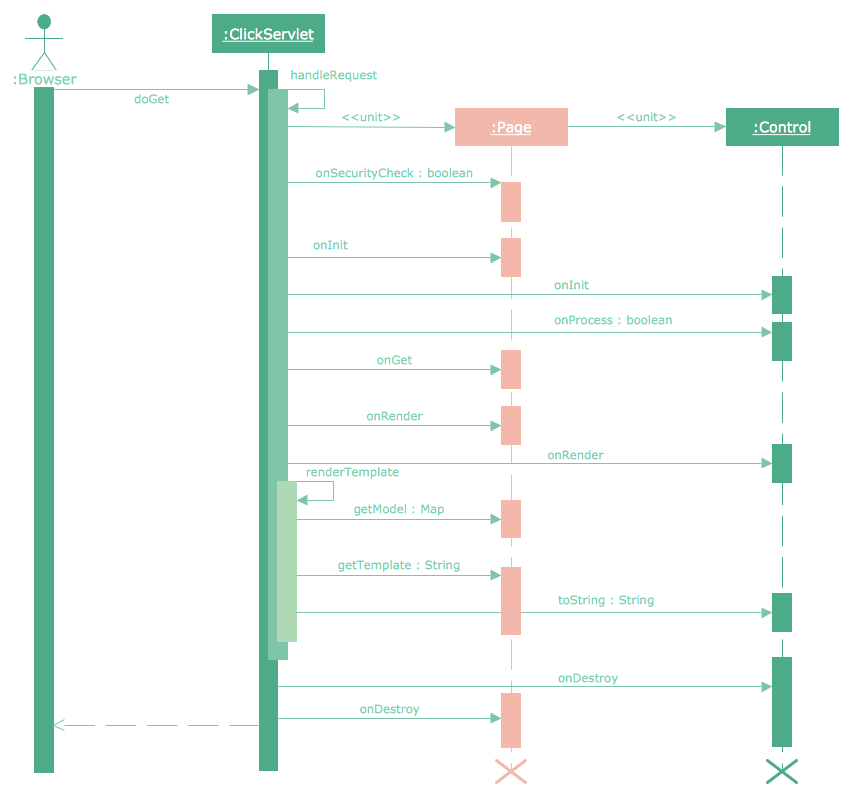
ConceptDraw DIAGRAM diagramming and vector drawing software as a sequence diagram tool provides the Rapid UML Solution from the Software Development Area that contains the UML Sequence library.Fishbone Software Tools for Design Element
Cause and Effect diagram (Ishikawa diagram or Fishbone diagram) software helps you to show in one diagram the factors of Equipment, People, Process, Environment, Management and Materials, which all in general affect the overall problem and gives the base for the further analysis. ConceptDraw DIAGRAM is perfect software for designers and software developers who need to create Fishbone diagrams. You will get a simple problem-analysis tool - Fishbone software tools for design element to easy construct specific diagrams and identify many possible causes for an effect to attack complex problem solving.Online Diagram Tool
ConceptDraw DIAGRAM diagramming and vector drawing software extended with Rapid UML Solution from the Software Development Area is a powerful online diagram tool that will help you design any types of UML diagrams simply and fast.UML Tool & UML Diagram Examples
The Unified Modeling Language (abbr. UML) is a general-purpose modeling language widely used in the field of software development, software engineering, education, science, industry, business. In 1997 the UML was approved as a standard by the OMG (Object Management Group) and in 2005 was published as ISO standard by the International Organization for Standardization. UML is widely and succesfully applied for optimization the process of software systems development and business systems analysis. There are used 14 types of UML diagrams, 7 from them depict structural information, another 7 types represent different types of behavior and aspects of interactions. Design of any automated process is easy with ConceptDraw DIAGRAM and unique Rapid UML solution from the Software Development area, which provides numerous UML examples, templates and vector stencils libraries for drawing all types of UML 1.x and UML 2.x diagrams. Use of predesigned UML diagram examples and templates lets you quickly start drawing your own UML diagrams in ConceptDraw DIAGRAM software.Bank Sequence Diagram
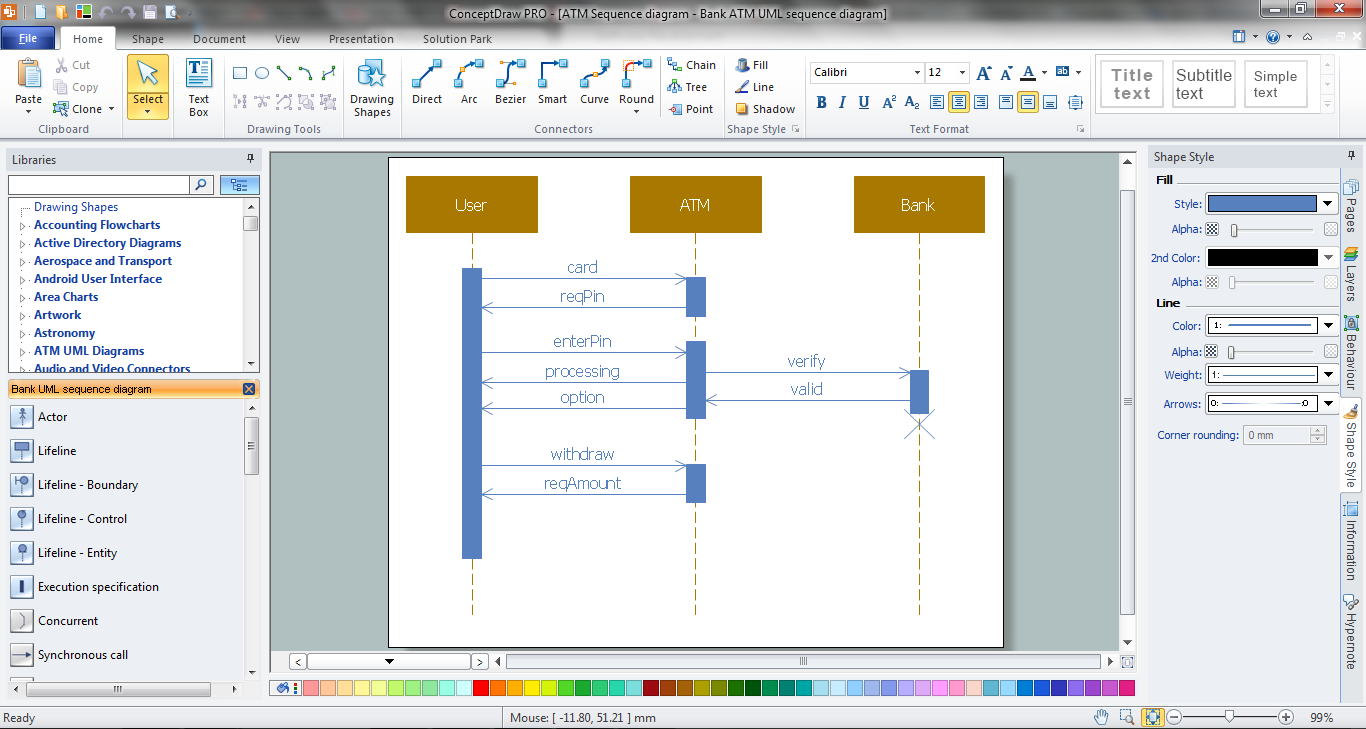
ConceptDraw DIAGRAM diagramming and vector drawing software enhanced with ATM UML Diagrams Solution from the Software Development Area of ConceptDraw Solution Park is a perfect tool for fast and easy creating the Bank Sequence Diagram.
 Rapid UML
UML Class Diagram
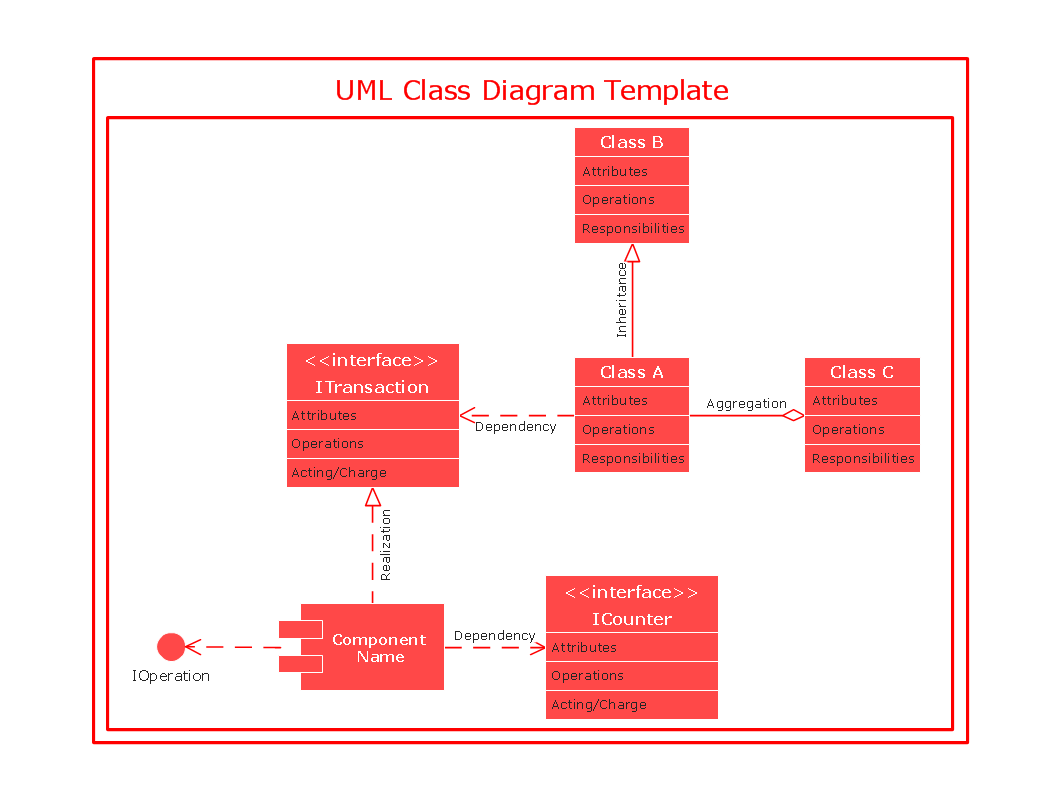
UML Class Diagram can be created using ConceptDraw DIAGRAM diagramming software contains rich examples and template. ConceptDraw is perfect for software designers and software developers who need to draw UML Class Diagrams.
UML State Machine Diagram.Design Elements
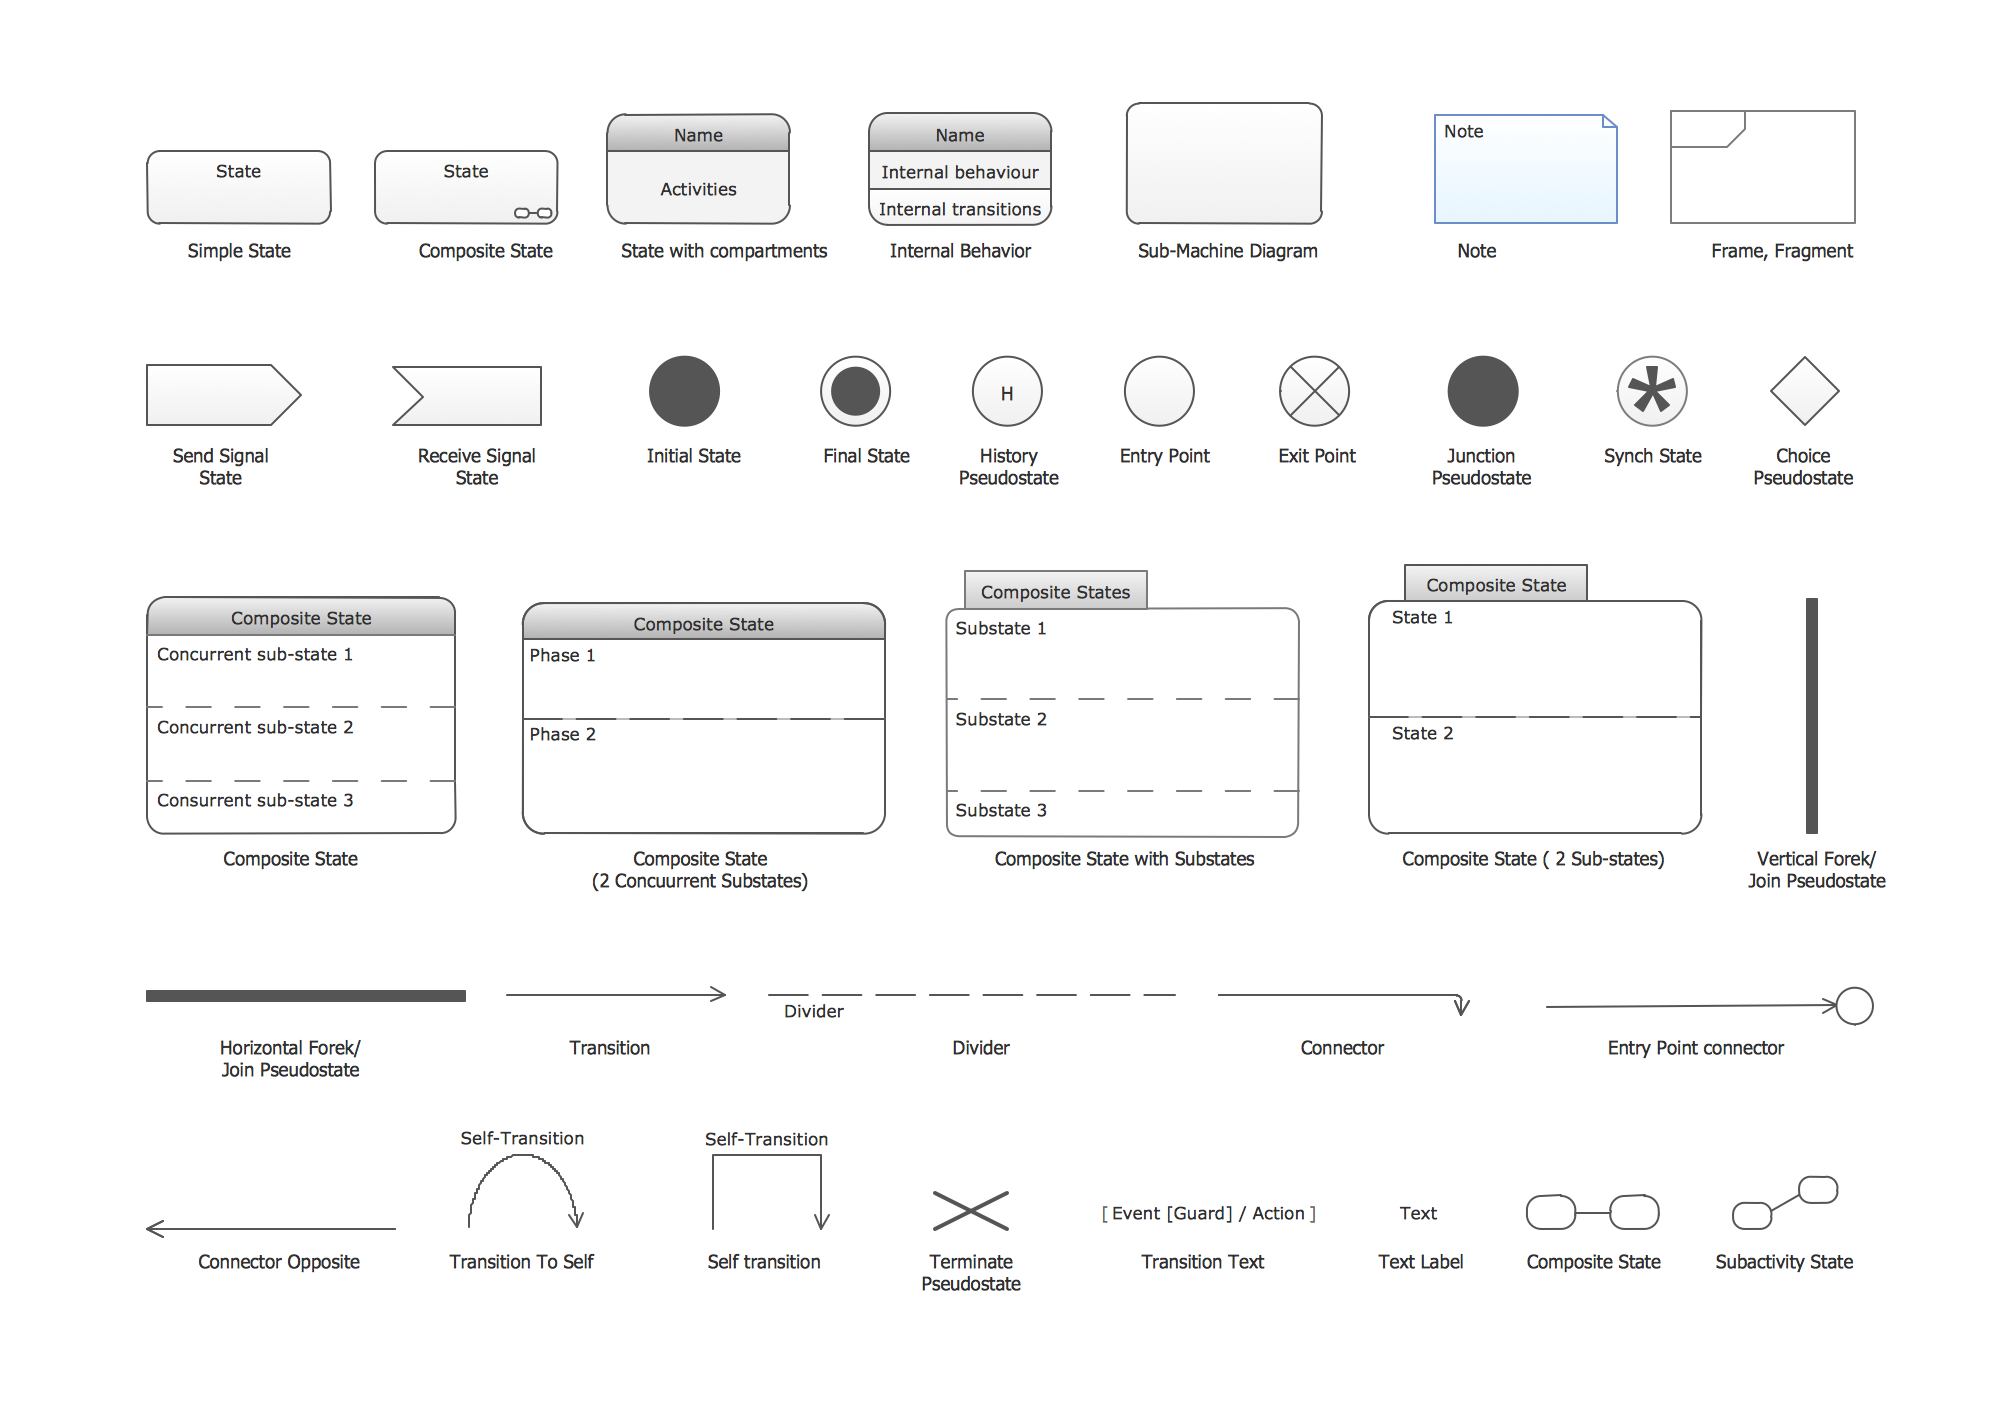
UML state machine's goal is to overcome the main limitations of traditional finite-state machines while retaining their main benefits. ConceptDraw has 393 vector stencils in the 13 libraries that helps you to start using software for designing your own UML Diagrams. You can use the appropriate stencils of UML notation from UML State Machine library.Infographic software: the sample of New York City Subway map
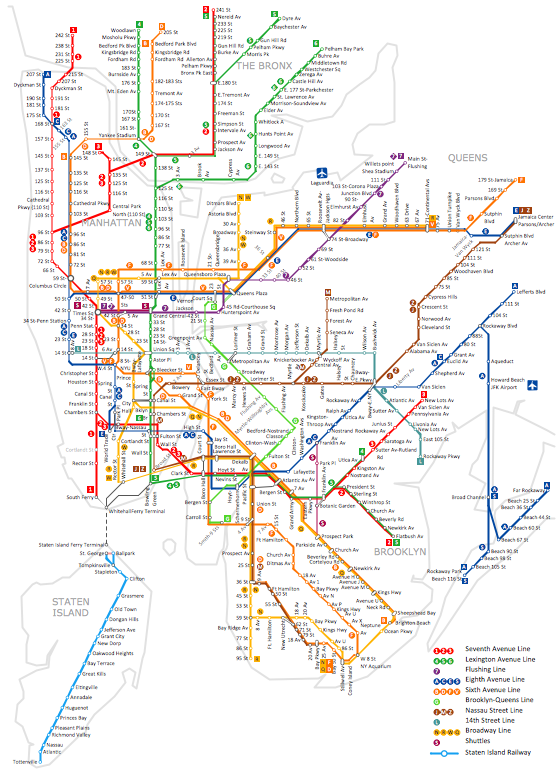
Tool to draw Metro Map styled inforgraphics. New York City Subway map sample.How To Make a Jackson Diagram
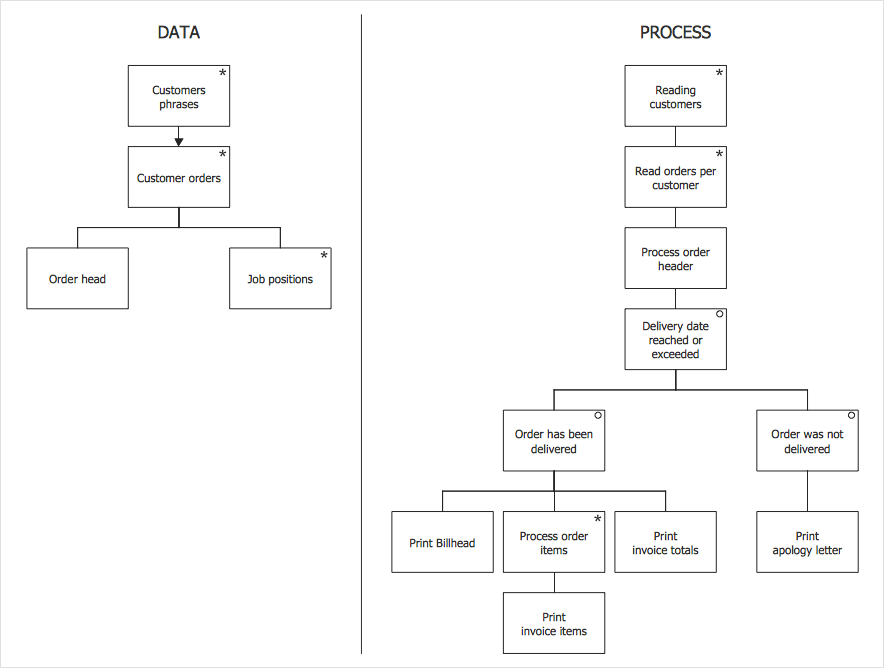
Jackson structured programming (JSP) is based on the fact that the program's structure depends on the structure of data, which need to be processed, so the data's structure can be used to form the program's structure. The following example of Jackson structured programming (JSP) diagram is created on the base of the Wikimedia Commons file. It includes two diagrams: Data diagram and Process diagram. The example was created using the vector library delivered with Jackson Structured Programming (JSP) Diagrams Solution.
Program for Making Presentations
ConceptDraw MINDMAP the will guide you in creating and demonstrating powerful mind map presentations.Software Diagram Examples and Templates
ConceptDraw DIAGRAM is a powerful tool for business and technical diagramming. Software Development area of ConceptDraw Solution Park provides 5 solutions: Data Flow Diagrams, Entity-Relationship Diagram (ERD), Graphic User Interface, IDEFO Diagrams, Rapid UML.Process Flow Diagram Symbols
Chemical and Process Engineering Solution from the Industrial Engineering Area of ConceptDraw Solution Park is a unique tool which contains variety of predesigned process flow diagram symbols for easy creating various Chemical and Process Flow Diagrams in ConceptDraw DIAGRAM.Technical Flow Chart Example
What illustrates a technical flow chart? Technical flow chart is a diagrammatic representation which visually illustrates the sequence of operations that must to be performed to get the problem's solution. ConceptDraw DIAGRAM enhanced with Flowcharts Solution from the "Diagrams" Area of ConceptDraw Solution is a perfect software for drawing Technical Flow Chart Example illustrating the essence and importance of the technical flow chart use.
 Jackson Structured Programming (JSP) Diagrams
3 Circle Venn Diagram. Venn Diagram Example
This template shows the Venn Diagram. It was created in ConceptDraw DIAGRAM diagramming and vector drawing software using the ready-to-use objects from the Venn Diagrams Solution from the "Diagrams" area of ConceptDraw Solution Park. Venn Diagrams visualize all possible logical intersections between several sets and are widely used in mathematics, logic, statistics, marketing, sociology, etc.- Activity Diagram Example Ppt
- Powerpoint Uml Shapes
- UML activity diagram (swimlanes) - Template
- Uml Architecture Diagram Examples Ppt
- UML sequence diagram - Template | Diagramming Software for ...
- UML package diagram - Template | UML activity diagram ...
- UML Diagrams with ConceptDraw DIAGRAM | UML Diagram for ...
- Stakeholder Onion Diagram Template | Organizational Chart ...
- Class Diagram On Powerpoint
- UML Deployment Diagram Example - ATM System UML diagrams ...
- Component Diagram Example Ppt
- Bank Management System With Uml Ppt Pdf
- UML Use Case Diagram Example Social Networking Sites Project ...
- Interaction Overview Diagram | UML Component Diagram Example ...
- Interaction Overview Diagram | UML Use Case Diagram Example ...
- Sequence Diagram for Cloud Computing | Cloud Computing ...
- Uml Diagrams For Atm Ppt Download
- Data Flow Diagram | Example of DFD for Online Store (Data Flow ...
- UML Deployment Diagram Example - ATM System UML diagrams ...



_Win_Mac.png)


