Data structure diagram with ConceptDraw DIAGRAM
Data structure diagram (DSD) is intended for description of conceptual models of data (concepts and connections between them) in the graphic format for more obviousness. Data structure diagram includes entities description, connections between them and obligatory conditions and requirements which connect them. Create Data structure diagram with ConceptDraw DIAGRAM.Databases Access Objects Model with ConceptDraw DIAGRAM
ConceptDraw Basic gives the opportunity of interaction with any ODBC-compatible databases. For this the Database Access Objects Model is provided. All calls to the database are made by certain methods of objects of this model.Software development with ConceptDraw DIAGRAM
Modern software development requires creation of large amount of graphic documentation, these are the diagrams describing the work of applications in various notations and cuts, also GUI design and documentation on project management. ConceptDraw DIAGRAM technical and business graphics application possesses powerful tools for software development and designing technical documentation for object-oriented projects. Solutions included to the Software Development area of ConceptDraw Solution Park provide the specialists with possibility easily and quickly create graphic documentation. They deliver effective help in drawing thanks to the included package of templates, samples, examples, and libraries with numerous ready-to-use vector objects that allow easily design class hierarchies, object hierarchies, visual object-oriented designs, flowcharts, GUI designs, database designs, visualize the data with use of the most popular notations, including the UML and Booch notations, easy manage the development projects, automate projection and development.Process Flowchart
The main reason of using Process Flowchart or PFD is to show relations between major parts of the system. Process Flowcharts are used in process engineering and chemical industry where there is a requirement of depicting relationships between major components only and not include minor parts. Process Flowcharts for single unit or multiple units differ in their structure and implementation. ConceptDraw DIAGRAM is Professional business process mapping software for making Process flowcharts, Process flow diagram, Workflow diagram, flowcharts and technical illustrations for business documents and also comprehensive visio for mac application. Easier define and document basic work and data flows, financial, production and quality management processes to increase efficiency of your business with ConcepDraw DIAGRAM. Business process mapping software with Flowchart Maker ConceptDraw DIAGRAM includes extensive drawing tools, rich examples and templates, process flowchart symbols and shape libraries, smart connectors that allow you create the flowcharts of complex processes, process flow diagrams, procedures and information exchange. Process Flowchart Solution is project management workflow tools which is part ConceptDraw Project marketing project management software. Drawing charts, diagrams, and network layouts has long been the monopoly of Microsoft Visio, making Mac users to struggle when needing such visio alternative like visio for mac, it requires only to view features, make a minor edit to, or print a diagram or chart. Thankfully to MS Visio alternative like ConceptDraw DIAGRAM software, this is cross-platform charting and business process management tool, now visio alternative for making sort of visio diagram is not a problem anymore however many people still name it business process visio tools.
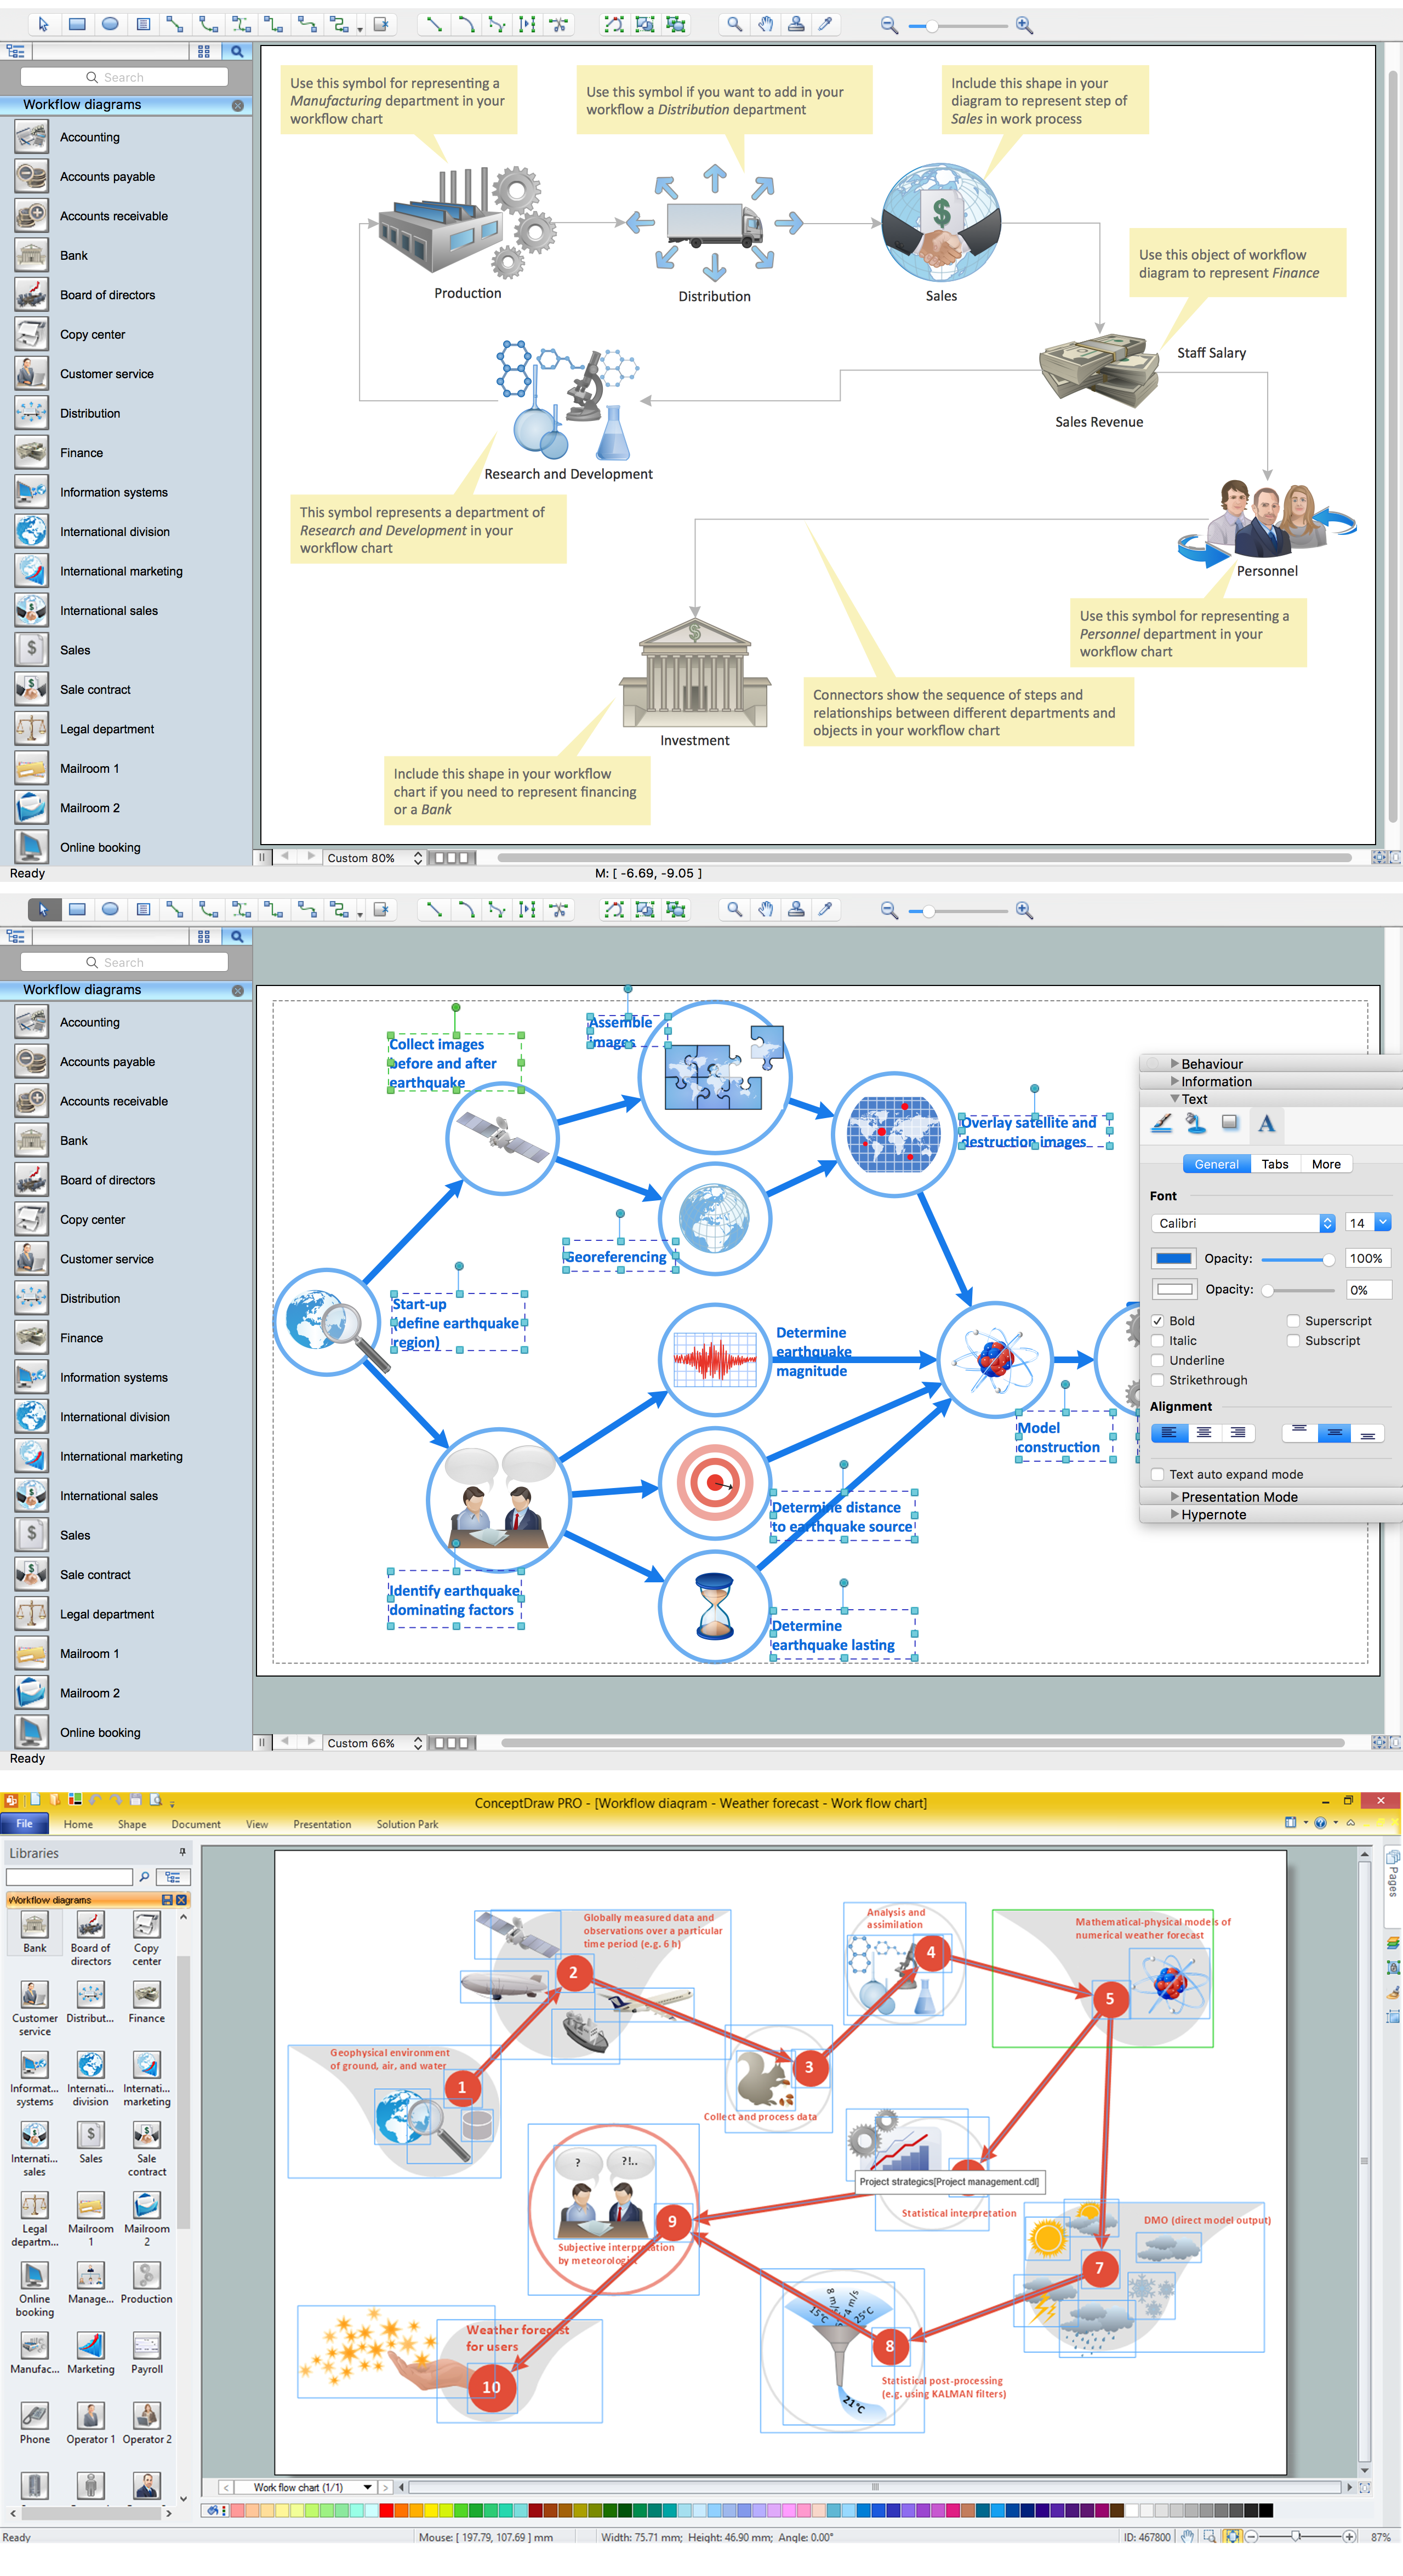
Workflow Diagram Data
Workflow Diagram created by using special software based on graphic mastering technology Arrows10. Its automatics follows the global concept of business graphics and diagramming. The practical effectiveness of Arrows10 technology used in ConceptDraw DIAGRAM are around the quick auto-arrows behaving as expected and connecting boxes of workflow diagram from workflow symbol to process flow symbol. ConceptDraw DIAGRAM is a workflow diagram software contains specific features help you to draw diagrams faster, such as RapidDraw, or Arrows10. There is also a rich set of samples and templates to give you an example of data may be visualized as workflow diagram.How to Draw an Organization Chart
An Organizational chart is a type of diagram which visually displays the structure of an organization, relationships and relative ranks of the organization′s parts and positions. Organizational chart is constructed as an hierarchical structure, in the form of tree. How to Draw an Organization Chart the most easy and quickly? The Organizational Charts solution, innovative Tree Auto-connection mode and ConceptDraw Arrows10 Technology included in ConceptDraw DIAGRAM software are powerful drawing tools that change the way of diagrams production. Arrows10 Technology provides smart behavior for the connectors, and so quick and precise placement when drawing, and lets easy make the changes and automatic rearrangement. It helps to make the process of drawing diagrams more efficient, easier and faster. Now, you don′t need to think on how to connect or place the objects, you can concentrate fully on what to draw. See obligatory the helpful video tutorial about creation the Organization Charts and orgchart professional presentations with ConceptDraw products.
 Active Directory Diagrams
Active Directory Diagrams solution significantly extends the capabilities of ConceptDraw DIAGRAM software with special Active Directory samples, convenient template and libraries of Active Directory vector stencils, common icons of sites and services, icons of LDPA elements, which were developed to help you in planning and modelling network structures and network topologies, in designing excellently looking Active Directory diagrams, Active Directory Structure diagrams, and Active Directory Services diagram, which are perfect way to visualize detailed structures of Microsoft Windows networks, Active Directory Domain topology, Active Directory Site topology, Organizational Units (OU), and Exchange Server organization.
Tree Network Topology Diagram
A Tree network topology (Hierarchical topology) is a hybrid network topology that contains the combination of two or more star networks connected via bus networks. Each star network is a LAN (local area network) with central computer or server and workstation nodes connected to it. The central computers of star networks are connected to a main cable that is called a bus. Each node of the Tree network can have an arbitrary number of child nodes, you can easy add/remove the separate workstations and even the whole star networks, the failure of one workstation will not affect the work of others. This topology is ideal solution when workstations are located in groups within a small physical region, rarely is used in WAN configurations. Computer and Networks solution from Computer and Networks area of ConceptDraw Solution Park contains templates, samples and numerous libraries of predesigned vector stencils of computer network devices and equipment, which can be effectively used for designing various network topologies diagrams, including Tree Network Topology.GUI Prototyping with ConceptDraw DIAGRAM
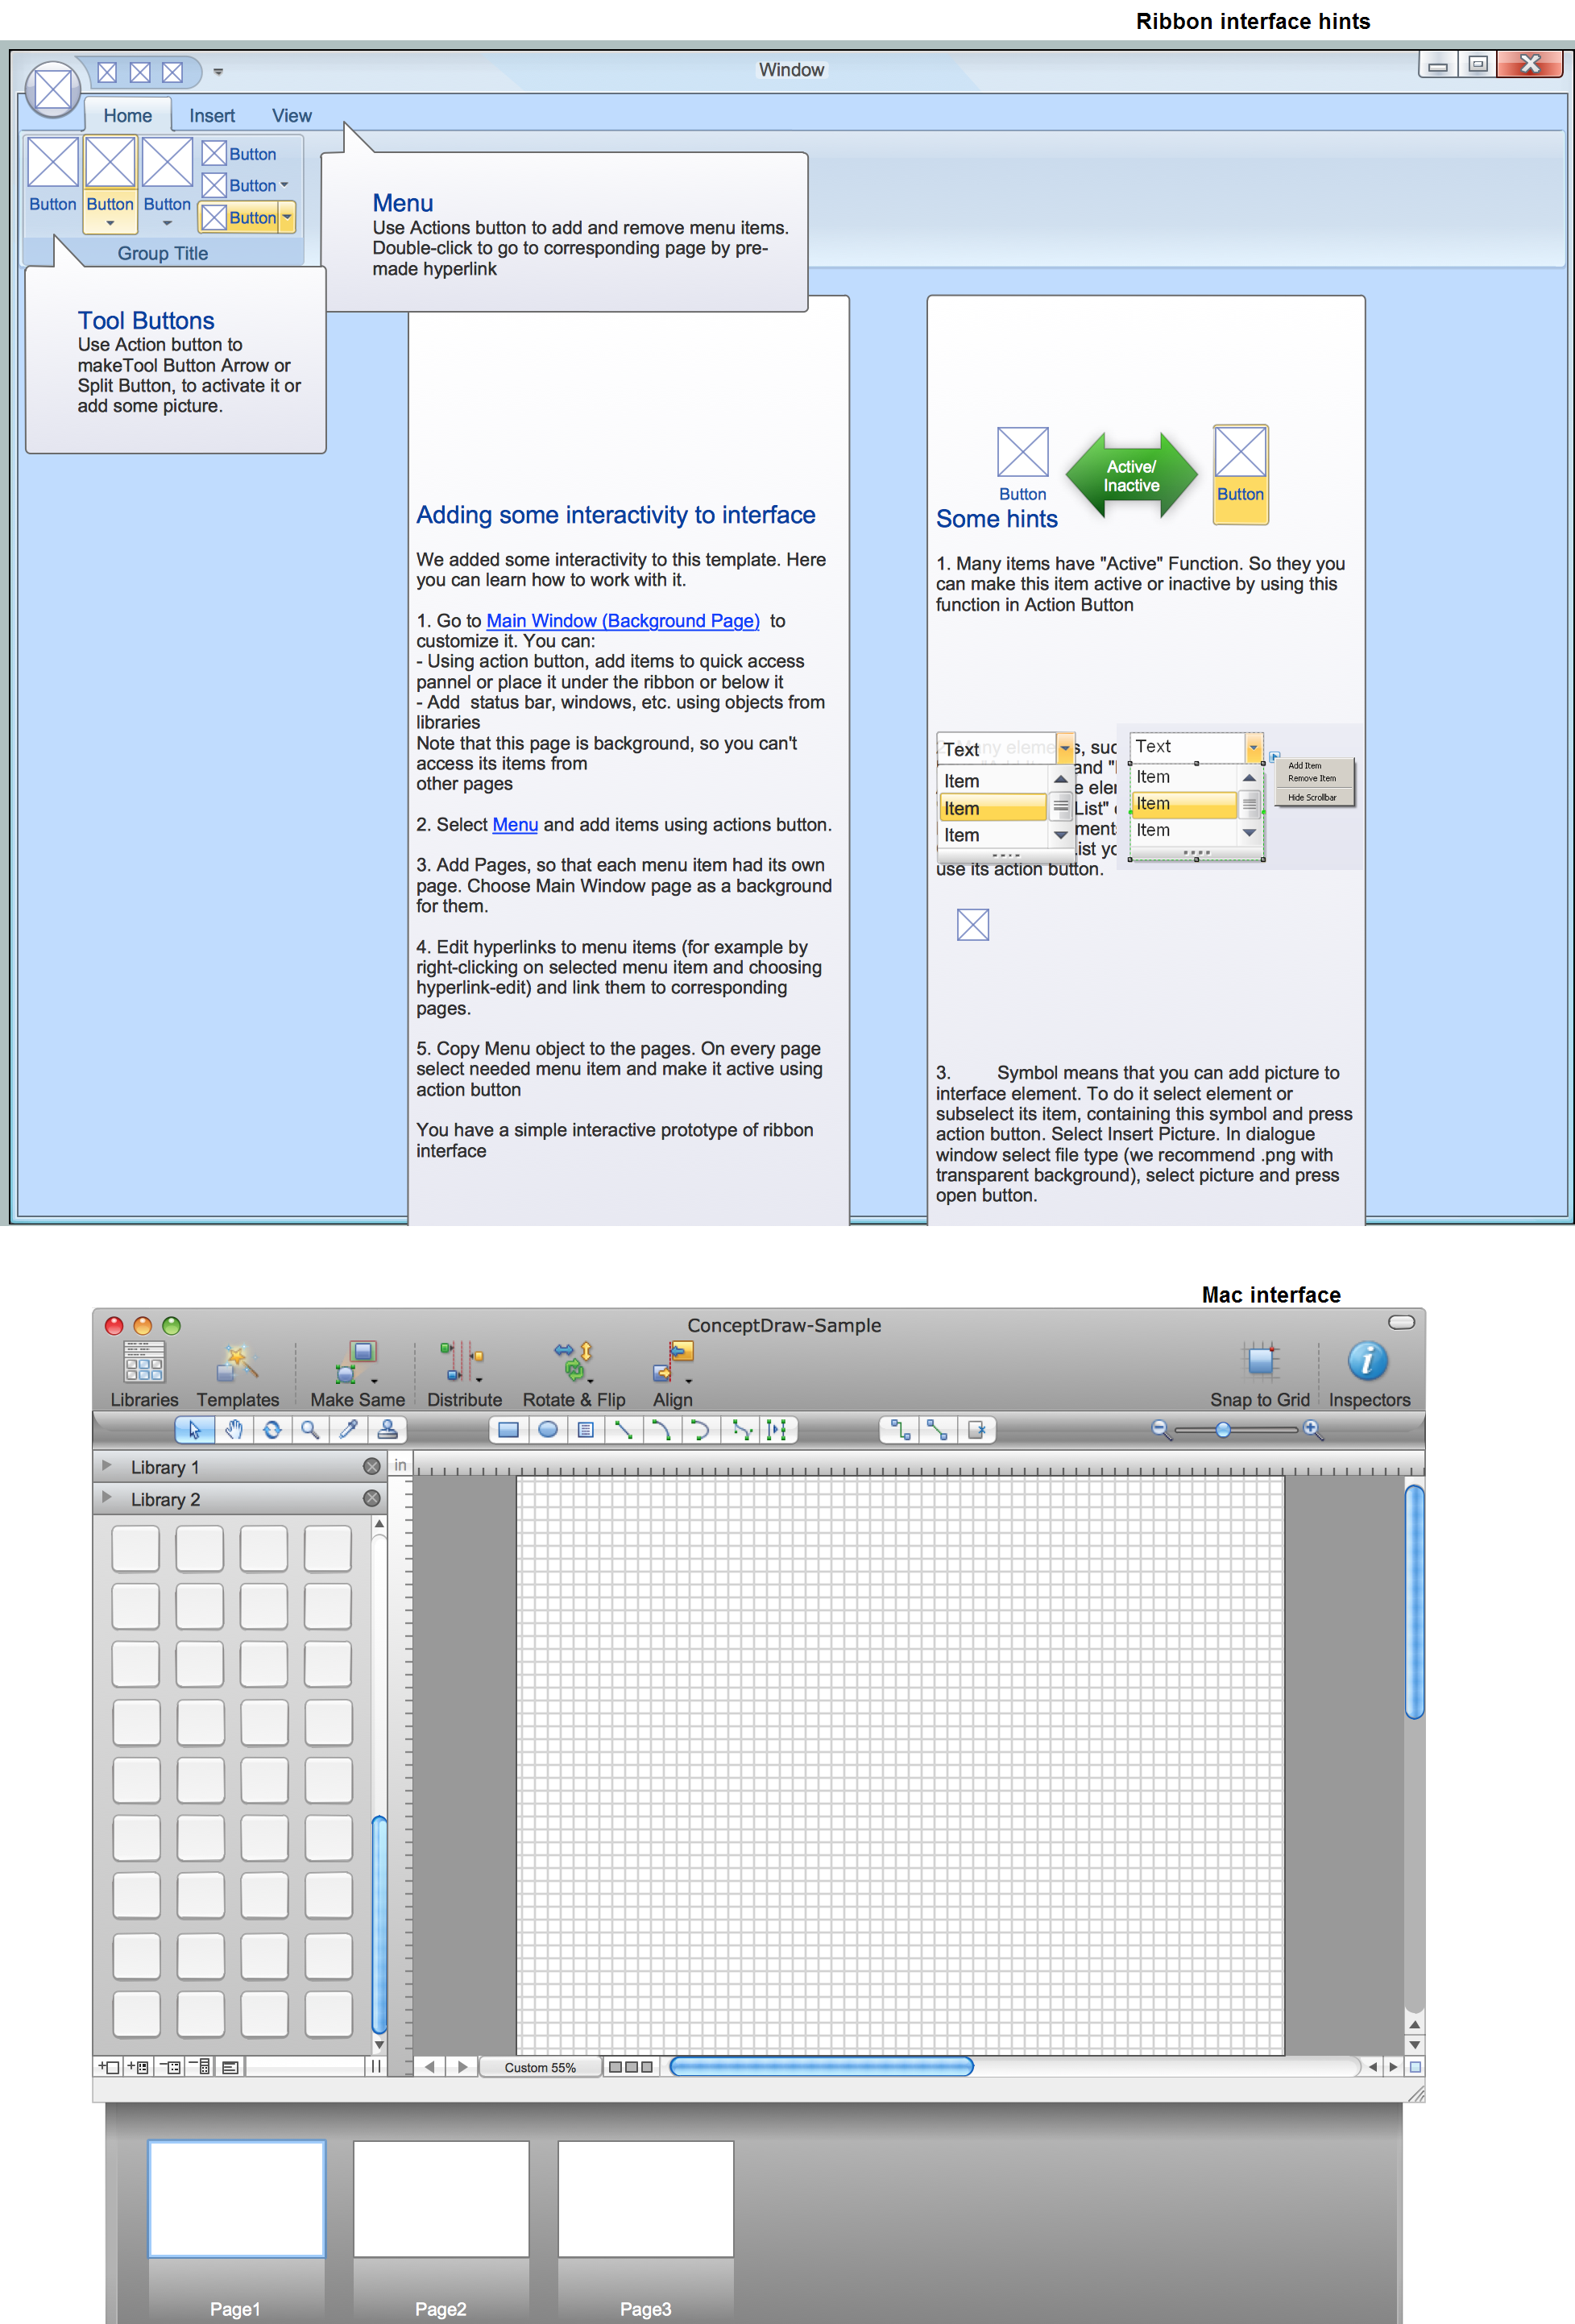
All about prototyping. GUI Prototyping with ConceptDraw. Download prototyping software.- Draw Hierarchical Database Of A Computer
- Network Drawing Software | Draw Hierarchy In Computer
- ConceptDraw PRO ER Diagram Tool | Develop Scripts Exchanging ...
- How to Draw a Hierarchical Organizational Chart with ConceptDraw ...
- Draw The Tree Structure Of Memory And Describe It With Example
- How to Draw a Hierarchical Organizational Chart with ConceptDraw ...
- Fundraising Pyramid | Pyramid Chart Examples | Process Flowchart ...
- Holiday | How to Draw a Pyramid Diagram in ConceptDraw PRO ...
- Entity-Relationship Diagram (ERD) | Fault Tree Analysis Diagrams ...
- Hierarchical Structure Diagram


