How to Create Presentation of Your Project Gantt Chart
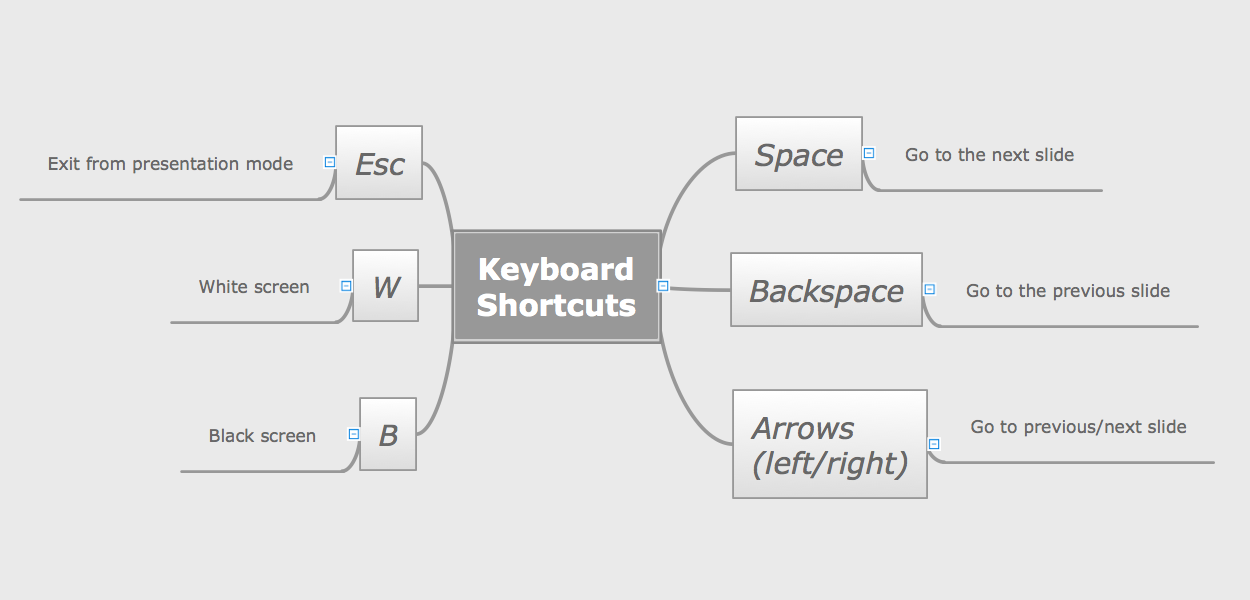
During the planning, discussing and execution of a project you may need to prepare a presentation using project views such as the Gantt Chart, Multiproject Dashboard or Resource Usage View. It’s easy do with ConceptDraw PROJECT!Process Flowchart
The main reason of using Process Flowchart or PFD is to show relations between major parts of the system. Process Flowcharts are used in process engineering and chemical industry where there is a requirement of depicting relationships between major components only and not include minor parts. Process Flowcharts for single unit or multiple units differ in their structure and implementation. ConceptDraw PRO is Professional business process mapping software for making Process flowcharts, Process flow diagram, Workflow diagram, flowcharts and technical illustrations for business documents and also comprehensive visio for mac application. Easier define and document basic work and data flows, financial, production and quality management processes to increase efficiency of your business with ConcepDraw PRO. Business process mapping software with Flowchart Maker ConceptDraw PRO includes extensive drawing tools, rich examples and templates, process flowchart symbols and shape libraries, smart connectors that allow you create the flowcharts of complex processes, process flow diagrams, procedures and information exchange. Process Flowchart Solution is project management workflow tools which is part ConceptDraw Project marketing project management software. Drawing charts, diagrams, and network layouts has long been the monopoly of Microsoft Visio, making Mac users to struggle when needing such visio alternative like visio for mac, it requires only to view features, make a minor edit to, or print a diagram or chart. Thankfully to MS Visio alternative like ConceptDraw PRO software, this is cross-platform charting and business process management tool, now visio alternative for making sort of visio diagram is not a problem anymore however many people still name it business process visio tools.
Mac Compatible Remote Presentation
Mac compatible remote presentation, A simple way to share your presentation remotely via Skype. All participants receive presentation file.
How to do presentation of Mind Maps via Skype conference call?
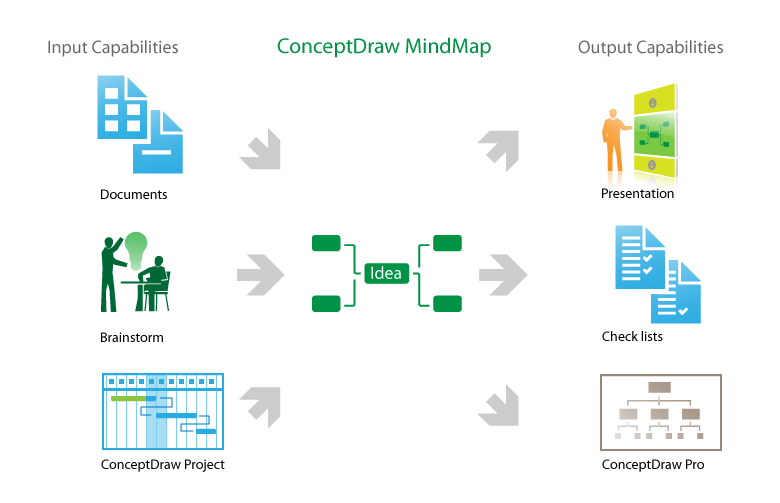
ConceptDraw MINDMAP is powerful and multifunctional mind mapping software with wide variety of relevant features, which make it comfortable for brainstorming, generating ideas, creating beautiful and professional-looking Mind Maps. ConceptDraw MINDMAP provides wide importing and exporting capabilities to variety of formats, among them MS PowerPoint, MS Word, MS Excel, FreeMind, XMind, MindJet Mindmanager, HTML, PDF, graphical formats. An innovative Skype conference call feature deserves the special attention of users, it is useful for teams, it lets to hold the presentations of Mind Maps via Skype and to collaborate in active Skype call. But how to do the presentation of Mind Map via Skype conference call by means of ConceptDraw MINDMAP software? Simply make the Skype conference call, share the presentation via Skype for active call participants using the Remote Presentation for Skype solution, keep the presentation file synchronized between all participants of Skype call. ConceptDraw MINDMAP lets also edit a Mind Map and to do slide show again with no interruption a call.Software Flow Chart
Many professionals have to solve problems every day. Designing of the process algorithm contribute to understand where the problem is in the process. A Flowchart is a graphical tool that most usable for breaking down processes. Definition of flowchart - a diagram that shows step-by-step progression through a procedure or system especially using connecting lines and a set of conventional symbols. All the icons, symbols and connectors needed for creating standardized notation flowcharts are contained within Software Flow Chart.Basic Diagramming
Perfect charts and graphics diagramming software with rich examples and template. ConceptDraw is ideal to draw Charts and Graphics.
How To Use Collaboration Software
Collaboration Software helps to transform shared MINDMAP documents to build an effective team collaboration.
Astronomy Symbols
Are you an astronomer, astronomy teacher or student? And you need to draw astronomy pictures quick and easy? ConceptDraw PRO diagramming and vector drawing software extended with Astronomy solution from the Science and Education area will help you! Astronomy solution provides 7 libraries with wide variety of predesigned vector objects of astronomy symbols, celestial bodies, solar system symbols, constellations, etc.Sales Process Flowchart Symbols
The most easier way of creating the visually engaging and informative Sales Process Flowchart is to create the new ConceptDraw document and to use the predesigned vector symbols offered in 6 libraries of the Sales Flowchart Solution. There are more than six types of sales process flow diagrams, ConceptDraw PRO software is flowchart maker which include six collections of extended flowchart symbols for effective diagramming. There are main collections of color coded flowchart symbols: Sales Department, Sales Steps, Sales Workflow, Sales Symbols and special set of Sales Arrows and Sales Flowchart.Audit Flowchart Symbols
The audit is a complex process consisting of defined quantity of steps, which have as a final goal the ensuring of success of a certain business project. It includes the independent examination of data, statements and financial performances of an enterprise for a stated purpose. It is convenient to construct the Audit Flowcharts or Audit Diagrams for visual representation and structuring the audit processes. ConceptDraw PRO diagramming software enhanced with Audit Flowcharts solution from the Finance and Accounting area of ConceptDraw Solution Park effectively helps to draw the Audit Diagrams for accounting, finance and money management, the Audit Flowcharts for fiscal information tracking, financial inventories and documenting Six Sigma, the decision making Flow Charts, etc. This solution provides the powerful drawing tools, numerous templates and samples, and large quantity of vector audit flowchart symbols that greatly facilitate the process of representation the audit steps and audit results, and designing efficient and visually appealing Audit Flowcharts.Steps in the Accounting Process
Steps in the Accounting Process - The Accounting Process is a sequence of organization activities that is used for gaining quantitative information about the finances. This complex process consists of a set of sequential steps. 9 steps in the accounting process: Analysis of Business Transactions, Make Journal Entries, Post to Ledger Accounts, Prepare Trial Balance, Make Adjusting Entries, Adjusted Trial Balance, Prepare Financial Statements, Close Accounts, Post-Closing Trial Balance.Flowchart Software
Flowchart is a simple diagram, map or graphical schematic representation the sequence of actions within a process. It is ideal for displaying how a process currently flows or can function ideally. The Flowcharts let define the steps and boundaries of a process, uncover problems or miscommunications. The Flowcharts are widely used in education, software development, business, economics, thanks to their visuality they are ideal for presentations, reports, for using on conferences to help the audience comprehend the content better, or easy find flaws in a process flow diagrams. ConceptDraw PRO is professional flowcharts software and feature-rich flowchart maker, which supports Mac OS X and Windows. It contains at ConceptDraw Solution Park a rich set of stencils and professional flowchart symbols for design. It lets create simply professional-looking Flowcharts based on thousand free flowchart templates, colored symbols and examples. ConceptDraw PRO is a 3 times cheaper alternative to MS Visio available for both Mac and PC. It’s is another full featured business and technical diagramming application that can easily take care of Visio files within OS X. Another bonus with ConceptDraw PRO – it's cross-platform. You can work on a document in both OS X and Windows, skipping Visio entirely.
Sign Making Software
ConceptDraw PRO is a powerful sign making software thanks to the vector stencils library "Recreation signs". This library is included in the Directional Maps solution from the Maps area of ConceptDraw Solution Park. Sign making software is very useful tool for professional sign-making business. Use ConceptDraw PRO and make sure that now sign making is easier and timesaving than ever!Sales Process Flowcharts
ConceptDraw PRO diagramming and vector drawing software extended with Sales Flowcharts solution from the Marketing area of ConceptDraw Solution Park offers the set of extensive tools for quick and easy drawing professional looking Sales Process Flowcharts.ConceptDraw PRO - Organizational chart software
Organizational Chart is a scheme which visualizes the composition of departments, sectors and other functional units of an organization, and also fixed relationships that exist between divisions and employees. ConceptDraw PRO enhanced with Organizational Charts solution is a powerful and cost effective Organizational chart software, which allows to automate the process of creation the high standard organizational charts, flow charts, time lines, and much more diagrams. It can be applied for analyzing organizational structure and drawing single or multi-page Organizational Charts with hyperlinks for the companies of any type, size and direction. Visualize the structure using the orgchartal tools, create easily as never before the Company Organizational Chart, Corporate Organizational Chart, Hospital Organizational Chart, University Organizational Chart, Hotel Organizational Chart, and then export, send by e-mail or publish it on Web in minutes, to communicate and discuss with colleagues or any other interested people.- Basic Flowchart Symbols and Meaning | Flow Chart Symbols ...
- Basic Flowchart Symbols and Meaning | Audit Flowchart Symbols ...
- Pictorial Presentation Of Flow Chart Symbols
- Flow Chart Symbols | How to Create Presentation of Your Project ...
- How to Create Presentation of Your Project Gantt Chart | Flow Chart ...
- Pictorial Presentation Of Flowchart Symbols
- Basic Flowchart Symbols and Meaning | How to Add a Bubble ...
- General Presentation Of Chemistry With Flow Charts
- Pictorial Presentation Of 15 Flow Chart Symbols
- Mathematics Symbols | Astronomy | Presentation Exchange | Solar ...
- Process Flowchart | Basic Flowchart Symbols and Meaning | How to ...
- Basic Flowchart Symbols and Meaning | Chart Software for Better ...
- Astronomy | Presentation Exchange | eLearning for Skype | Pie ...
- Basic Flowchart Symbols and Meaning | Process Flowchart ...
- Design elements - Presentation symbols | Mac Compatible Remote ...
- Presentation Clipart | Design elements - Presentation symbols ...
- Process Flowchart | Basic Flowchart Symbols and Meaning | How to ...
- Basic Flowchart Symbols and Meaning | UML Block Diagram ...
- Pictorial Presentation Of Flow Chat Symbols
- All Mechanical Drawing Symbols Charts Ppt


