 PM Presentations
This solution extends ConceptDraw MINDMAP and ConceptDraw PRO software, improving the efficiency of the project management process by using the same source data to build targeted presentations.
 Entity-Relationship Diagram (ERD)
An Entity-Relationship Diagram (ERD) is a visual presentation of entities and relationships. That type of diagrams is often used in the semi-structured or unstructured data in databases and information systems. At first glance ERD is similar to a flowch
 What is a Dashboard Area
Solutions from the area What is a Dashboard of ConceptDraw Solution Park collects templates, samples and vector stencils libraries with of data driven charts and indicators for drawing the basic types of Visual Dashboards.
HelpDesk
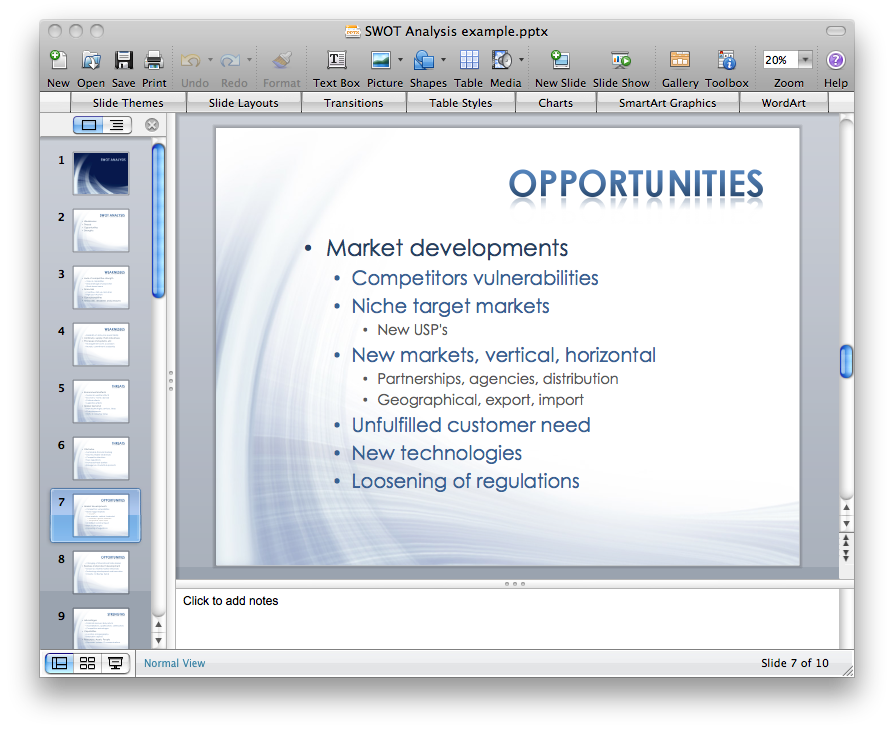
How to Create a PowerPoint Presentation from a SWOT Matrix
You can use SWOT analysis PowerPoint presentation to represent strengths, weakness, opportunities, and threats involved in your SWOT matrix.HelpDesk
How to Create a Fishbone (Ishikawa) Diagram Quickly
A Fishbone (Ishikawa) diagram is also called cause-and-effect diagram. Fishbone diagram is often used in business to determine the cause of some problem. The diagram illustrates the main causes and sub-causes leading to an event. The main goal of the Fishbone diagram is to illustrate in a graphical way the relationship between a given outcome and all the factors that influence this outcome. The complete diagram resembles a fish skeleton as its name implies. The ability to create a Fishbone Diagram is supported by the Fishbone Diagram solution. Use ConceptDraw MINDMAP for structuring data and then ConceptDraw PRO for generating a Fishbone Diagram from mind map structure.
 Telecommunication Network Diagrams
Telecommunication Network Diagrams solution extends ConceptDraw PRO software with samples, templates, and great collection of vector stencils to help the specialists in a field of networks and telecommunications, as well as other users to create Computer systems networking and Telecommunication network diagrams for various fields, to organize the work of call centers, to design the GPRS networks and GPS navigational systems, mobile, satellite and hybrid communication networks, to construct the mobile TV networks and wireless broadband networks.
HelpDesk
Event-driven Process Chain (EPC) Diagram Software
An EPC diagram is a type of flowchart used in business process analysis. It shows different business processes through various work flows. The workflows are shown as processes and events that are related to different executes and tasks that allow business workflow to be completed. An EPC diagram shows different business processes through various workflows. The workflows are seen as functions and events that are connected by different teams or people, as well as tasks that allow business processes to be executed. The best thing about this type of enterprise modelling is that creating an EPC diagram is quick and simple as long as you have the proper tool. One of the main usages of the EPC diagrams is in the modelling, analyzing and re-engineering of business processes. With the use of the flowchart, businesses are able to see inefficiencies in the processes and modify to make them more productive. Event-driven process chain diagrams are also used to configure an enterprise resource pla- Orgchart | Presentation Of Data And Information Of Partnership Firm ...
- Presentation Of Data And Information Of Partnership Firm And ...
- Partnership Firm Presentation Of Data And Information
- Partnership Firm Process Presentation Of The Data Information
- Presentation Of Data Of Partnership Firm
- Data Collection Of Partnership Firm
- Presentation Of Data And Information Of Partnership Firm Process
- Partnership Firm Process And Procedure Information
- Presentation Of Data And Information Of Partnerships Firms
- Presentation Of The Data And Information Of Dissolution Of ...
- Presentation Of Daymta And Imformation Of Partnership Firm
- Analysis On Partnership Firm
- Partnership Firm Is An Process And Producer Of Analysis Of Data
- Analysis Partnership Firm Process And Producers
- Anlyasis Collection Of Data Partnership Firm
- Chart Procedure Of Partnership Firm
- Partnership Firm Process N Procedure Project Presentation N Data ...
- Partnership Organizational Plan
- Analyse The Process And Procedure Of Partnership
- Audit Process Flowchart. Audit Flowchart | Audit Steps | Internal ...


