The vector stencils library "Target diagrams" contains 13 templates of target diagrams: marketing mix diagram, principles of marketing diagram, circle diagram, macro-micro environment diagram, stakeholder diagram, target market scope diagram.
Use these shapes to illustrate your marketing and sales documents, presentations, webpages and infographics in the ConceptDraw PRO diagramming and vector drawing software extended with the Target and Circular Diagrams solution from the Marketing area of ConceptDraw Solution Park.
www.conceptdraw.com/ solution-park/ marketing-target-and-circular-diagrams
Principles of marketing by Ph. Kotler

Marketing mix

Target

Principles of marketing by Ph. Kotler (prompt)
-target-diagrams---vector-stencils-library.png--diagram-flowchart-example.png)
Circle diagram

Macro-micro environmental forces diagram

Macro-micro environmental forces diagram (prompt)
-target-diagrams---vector-stencils-library.png--diagram-flowchart-example.png)
Stakeholder diagram

Target market scope diagram

Target diagram 1

Target diagram 2

Target diagram 3

Target diagram

 Circle-Spoke Diagrams
Examples of subject areas that are well suited to this approach are marketing, business, products promotion, process modeling, market, resource, time, and cost analysis. Circle-Spoke Diagrams are successfully used in presentations, conferences, management documents, magazines, reportages, reviews, reports, TV, and social media.
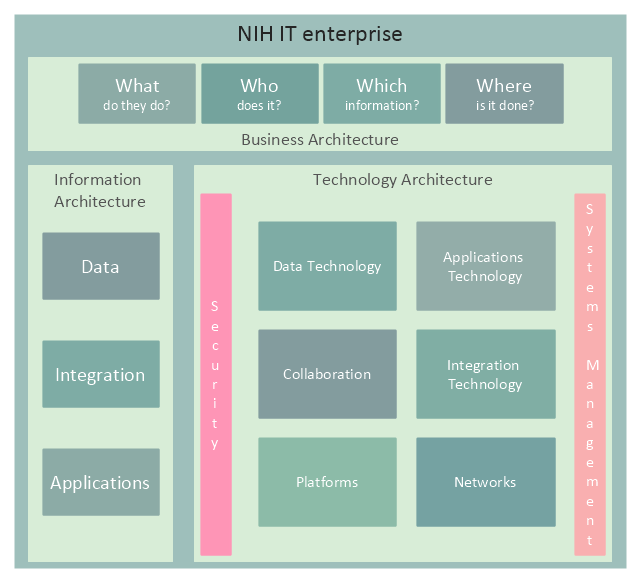
This enterprise architecture diagram sample was redesigned from the illustration of the NIH Enterprise Architecture website. [enterprisearchitecture.nih.gov/ Pages/ Framework.aspx]
"Enterprise architecture is a comprehensive framework used to manage and align an organization's Information Technology (IT) assets, people, operations, and projects with its operational characteristics. In other words, the enterprise architecture defines how information and technology will support the business operations and provide benefit for the business.
It illustrates the organization’s core mission, each component critical to performing that mission, and how each of these components is interrelated. These components include:
(1) Guiding principles,
(2) Organization structure,
(3) Business processes,
(4) People or stakeholders,
(5) Applications, data, and infrastructure,
(6) Technologies upon which networks, applications and systems are built.
Guiding principles, organization structure, business processes, and people don’t sound very technical. That’s because enterprise architecture is about more than technology. It is about the entire organization (or enterprise) and identifying all of the bits and pieces that make the organization work." [enterprisearchitecture.nih.gov/ Pages/ what.aspx]
The example "NIH IT enterprise architecture framework" was created using the ConceptDraw PRO diagramming and vector drawing software extended with the Enterprise Architecture Diagrams solution from the Management area of ConceptDraw Solution Park.
Enterprise architecture diagram
This circle diagram sample was redesigned from the Wikimedia Commons file: Research cycle.png. "Some of the basic elements of the scientific method, arranged in a cycle to emphasize that it is an iterative process." [commons.wikimedia.org/ wiki/ File:Research_ cycle.png]
This file is licensed under the Creative Commons Attribution 2.0 Generic license. [creativecommons.org/ licenses/ by/ 2.0/ deed.en]
"The scientific method is a body of techniques for investigating phenomena, acquiring new knowledge, or correcting and integrating previous knowledge. To be termed scientific, a method of inquiry must be based on empirical and measurable evidence subject to specific principles of reasoning. ...
Four essential elements of the scientific method are iterations, recursions, interleavings, or orderings of the following:
(1) Characterizations (observations, definitions, and measurements of the subject of inquiry).
(2) Hypotheses (theoretical, hypothetical explanations of observations and measurements of the subject).
(3) Predictions (reasoning including logical deduction from the hypothesis or theory).
(4) Experiments (tests of all of the above)...
A linearized, pragmatic scheme of the four points above is sometimes offered as a guideline for proceeding:
(1) Define a question.
(2) Gather information and resources (observe).
(3) Form an explanatory hypothesis.
(4) Test the hypothesis by performing an experiment and collecting data in a reproducible manner.
(5) Analyze the data.
(6) Interpret the data and draw conclusions that serve as a starting point for new hypothesis.
(7) Publish results.
(8) Retest (frequently done by other scientists).
The iterative cycle inherent in this step-by-step method goes from point 3 to 6 back to 3 again." [Scientific method. Wikipedia]
The circle diagram example "Research cycle" was created using the ConceptDraw PRO diagramming and vector drawing software extended with the Target and Circular Diagrams solution from the Marketing area of ConceptDraw Solution Park.
www.conceptdraw.com/ solution-park/ marketing-target-and-circular-diagrams
Circle diagram

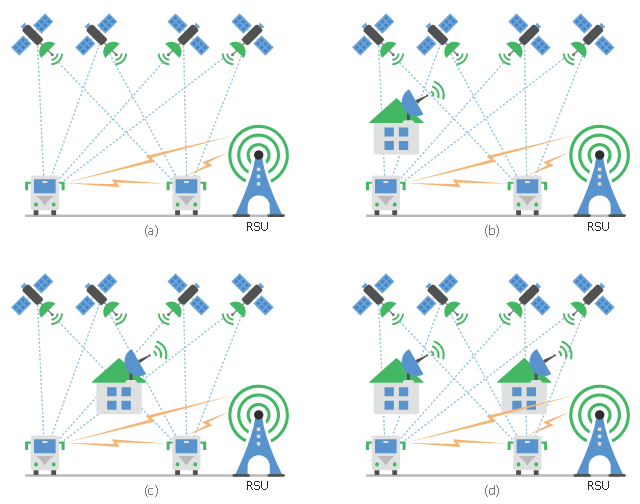
This diagram sample shows the different situations that cooperative positioning may be helpful for vehicular networks. It was designed on the base of Wikimedia Commons file: CPsituations.jpg.
[commons.wikimedia.org/ wiki/ File:CPsituations.jpg]
"Vehicular Ad Hoc Networks (VANETs) are created by applying the principles of mobile ad hoc networks (MANETs) - the spontaneous creation of a wireless network for data exchange - to the domain of vehicles. They are a key component of intelligent transportation systems (ITS).
While, in the early 2000s, VANETs were seen as a mere one-to-one application of MANET principles, they have since then developed into a field of research in their own right. By 2015, the term VANET became mostly synonymous with the more generic term inter-vehicle communication (IVC), although the focus remains on the aspect of spontaneous networking, much less on the use of infrastructure like Road Side Units (RSUs) or cellular networks." [Vehicular ad hoc network. Wikipedia]
The vehicular network diagram example "CP situations" was created using the ConceptDraw PRO diagramming and vector drawing software extended with the Computers and Communications solution from the Illustration area of ConceptDraw Solution Park.
Telecommunication diagram
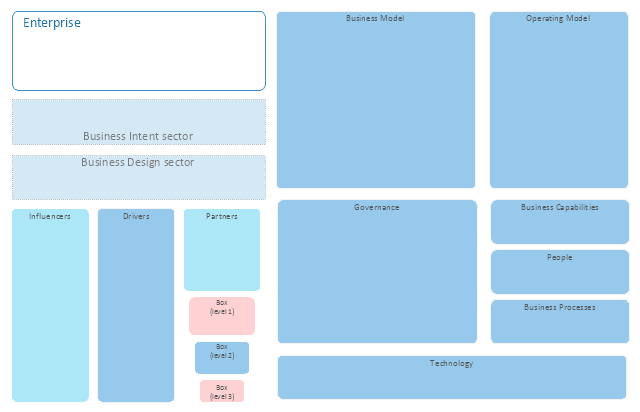
This library of vector stencils "Enterprise architecture diagrams" contains 16 shapes for visualizing the enterprise architecture (EA) models using the ConceptDraw PRO diagramming and vector drawing software.
"Enterprise architecture (EA) is "a well-defined practice for conducting enterprise analysis, design, planning, and implementation, using a holistic approach at all times, for the successful development and execution of strategy. Enterprise Architecture applies architecture principles and practices to guide organizations through the business, information, process, and technology changes necessary to execute their strategies. These practices utilize the various aspects of an enterprise to identify, motivate, and achieve these changes."
Practitioners of EA call themselves enterprise architects. An enterprise architect is a person responsible for performing this complex analysis of business structure and processes and is often called upon to draw conclusions from the information collected. By producing this understanding, architects are attempting to address the goals of Enterprise Architecture: Effectiveness, Efficiency, Agility, and Durability." [Enterprise architecture. Wikipedia]
The example "Design elements - Enterprise architecture diagram" is included in the Enterprise Architecture Diagrams solution from the Management area of ConceptDraw Solution Park.
Enterprise architecture diagram shapes
Bubble diagrams in Landscape Design with ConceptDraw DIAGRAM

HelpDesk
How to Create a Network Layout Floor Plan

HelpDesk
How to Create a VSM Diagram Using Solutions

- Principles Of Drwaing Venn Diagram
- Pyramid Diagram | Target Diagram | Circle-Spoke Diagrams ...
- Circle-Spoke Diagrams | Information Architecture | Target diagrams ...
- Principle Of Human Development In Venn Diagram
- Highlight The Principles Of Sustainable Development With Help The ...
- Daily Schedule Chart | Target Diagram | Circle-Spoke Diagrams ...
- Target diagrams - Vector stencils library | Target diagrams - Vector ...
- Competitor Analysis | Target diagrams - Vector stencils library ...
- Marketing mix - Wheel diagram | Target diagrams - Vector stencils ...
- Target diagrams - Vector stencils library | Marketing | Target ...
- Principles Of Flowcharting
- Target Diagram
- Venn Diagram Examples for Problem Solving. Environmental Social ...
- Marketing Diagrams | Marketing Analysis Diagram | Flowchart ...
- Target diagrams - Vector stencils library | UML Deployment Diagram ...
- Office Layout Plans | Basic Principle And Block Diagram Of Cctv
- Target Diagram | Target diagrams - Vector stencils library | The ...
- Marketing | Target diagrams - Vector stencils library | Target ...
- Marketing Target And Circular Diagrams
- Target diagrams - Vector stencils library | Competitor Analysis ...