Pyramid Diagram

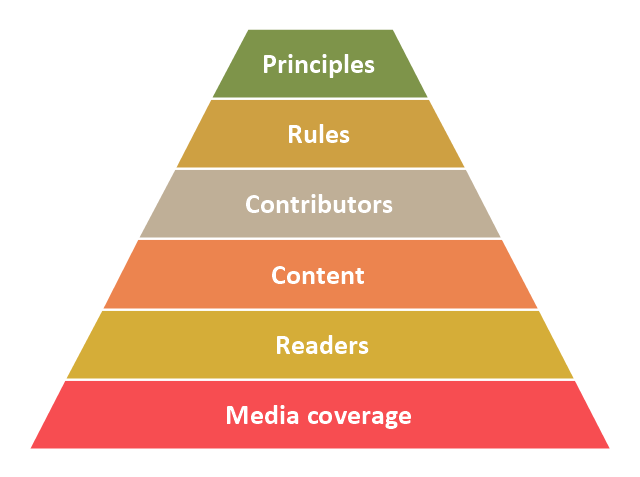
"Wikipedia's success metrics supersede each other in the following order:
1. Media coverage is the most basic metric for success – it provides notability and a public image for the project.
2. The number of readers supersedes media coverage – irrespective of the media, the number of actual readers matters more (high media coverage and low number of readers actually means the project is not successful; on the contrary, low media coverage and a high number of readers means the project is successful).
3. The quality and quantity of content is more important than the current number of readers – good content creates readership.
4. Content cannot be created without contributors, therefore the number of contributors and their ability to create meaningful content is more important than the current content.
5. Good contributors leave the project if they're not treated in a fair manner, and potential contributors are not interested in joining if they feel the project is misguided – therefore applying rules in a fair manner is more important than retaining contributors at any cost.
6. Misguided rules are guaranteed to ruin any enterprise, therefore all rules must necessarily be the result of applying healthy principles – the logic goes both ways, applying existing rules in fringe situations against the principles is disastrous." [Wikipedia's hierarchy of needs. Wikipedia]
This Wikipedia's hierarchy of priorities pyramid diagram was redesigned using the ConceptDraw PRO diagramming and vector drawing software from Wikimedia Commons file Wikipedia priority pyramid.png. [commons.wikimedia.org/ wiki/ File:Wikipedia_ priority_ pyramid.png]
This pyramid chart example is included in the Pyramid Diagrams solution from the Marketing area of ConceptDraw Solution Park.
Pyramid diagram
PROBLEM ANALYSIS. Prioritization Matrix


Pyramid Diagram

Cause and Effect Analysis

HelpDesk
How to Create a House of Quality Diagram
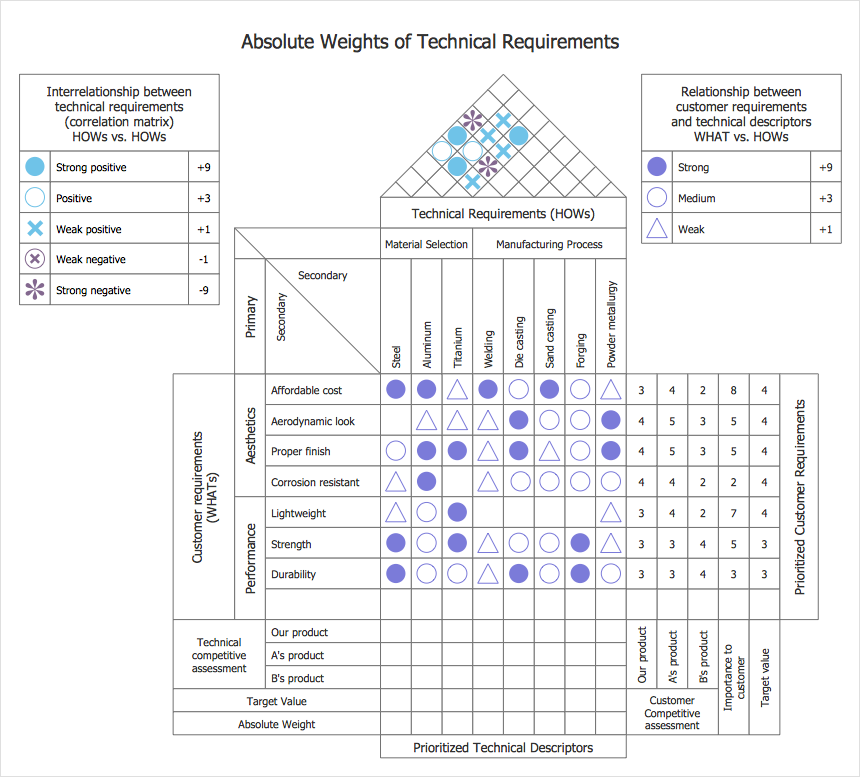
 House of Quality
House of Quality solution provides the powerful drawing tools, numerous specific samples and examples, and set of vector design elements of House of Quality shapes and symbols, which will help you in application the Quality function deployment (QFD) methodology and in easy creation the House of Quality Matrices intended for satisfaction the consumers' desires and requirements, for representing them in a visual way and then transformation into the targets and technical requirements to be followed for development the best products.
Workflow Diagram

Agile Methodology

Pyramid Diagram

- Priority pyramid diagram | Priority Pyramids
- PROBLEM ANALYSIS. Prioritization Matrix | Root Cause Analysis ...
- PROBLEM ANALYSIS. Prioritization Matrix | SWOT analysis ...
- Prioritization matrix - Template | How To Create a Prioritization ...
- PROBLEM ANALYSIS. Prioritization Matrix | Prioritization Matrix ...
- Diagram With Content
- Baseball Diagram — Defence Positions | Colored Baseball Field ...
- Prioritization matrix - Health care problems | Seven Management ...
- Order Processing Process Flow Chart