Corrective Action Planning
One of the stages of the problem's solving process scenario is Corrective Action Planning. Corrective action planning define people and groups involvement in corrective actions by roles, identify logical sequences of scheduled actions and critical path of problem solving, identify possible risks of action plan and propose preventive actions.
CORRECTIVE ACTIONS PLANNING. Involvement Matrix
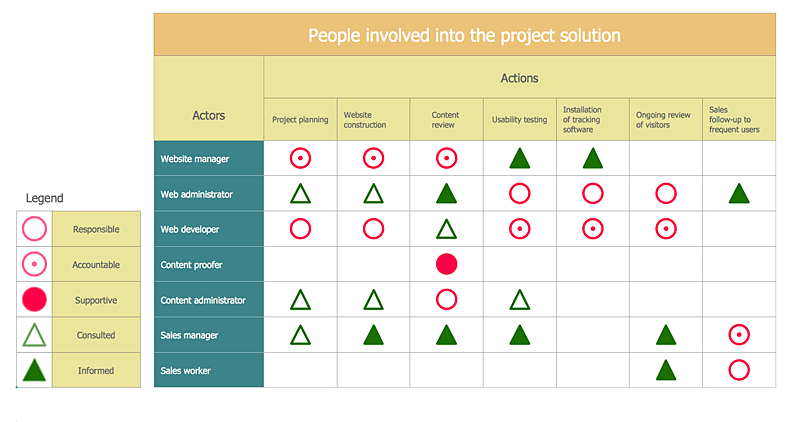
The Involvement Matrix can identify the distribution of responsibilities and identify roles in a group or team. Use the Involvement Matrix to specify roles and responsibilities of actions in problem solving. ConceptDraw Office suite is a software for corrective actions planning.
PROBLEM ANALYSIS. Root Cause Analysis Tree Diagram
Root Cause Analysis Tree Diagram. Use the Root Cause Diagram to perform visual root cause analysis. Root Cause Analysis Tree Diagram is constructed separately for each highly prioritized factor. The goal of this is to find the root causes for the factor and list possible corrective action. ConceptDraw Office suite is a software for problem analysis.
Root Cause Analysis
The Seven Management and Planning Tools is a tool for Root Cause Analysis Tree Diagram drawing. This diagram is for Root Cause Analysis. Analyze the root causes for factors that influenced the problem. This diagram is constructed separately for each highly prioritized factor. The goal of this is to find the root causes for the factor and list possible corrective action.
Cause and Effect Analysis
Cause and Effect Analysis - The Seven Management and Planning Tools is a tool for Cause and Effect Analysis that allows users to analyze the root causes for factors that influenced the problem. This diagram is constructed separately for each highly prioritized factor. The Diagram is then used for further formulation of potential actions.
HelpDesk
How To Create an Involvement Matrix
The Involvement Matrix can identify the distribution of responsibilities and identify roles in a group or team. This matrix can be used company-wide. The Involvement Matrix identifies participants who are involved in corrective actions. The Involvement Matrix is constructed for all highly prioritized corrective actions. It uses symbols to assign who participates, performs, consults, should be informed, checks the work, and accepts the results. Using visual diagrams keeps ideas clear and is very effective when discussing the problem and a description of the solution. They are great at helping to quickly see what stage of the problem-solving effort is currently underway. It defines the participants and their roles. The matrix displays all of the parties involved, defines their level of involvement, and the nature of their participation. The ability to create an Involvement Matrix is supported by the ConceptDraw Seven Management and Planning Tools solution.Affinity Diagram
The Affinity Diagram, also known as a KJ diagram, is a business tool invented for organization the large quantity of ideas and data. It is a part of Seven Management and Planning Tools, it is usually used right after brainstorming to sort large numbers of ideas into the corresponding groups. The Affinity Diagram helps to represent in a better way the structure of large and complex factors which influence on a problem, divides these factors into the smaller and simpler structures, and helps team members to see the patterns and identify possible solutions to problems they have. The diagrams of this type don't show the causal relationships between the factors, but they are designed to prepare the data for holding further analysis of the cause-effect relationships. Another area of Affinity Diagram usage is contextual inquiry as a way to sort observations and notes from field interviews, support call logs, open-ended survey responses organizing, etc. ConceptDraw MINDMAP software offers you the tools for easy holding brainstorming, generation ideas and creation MINDMAP Affinity Diagram.Using Fishbone Diagrams for Problem Solving
Problems are obstacles and challenges that one should overcome to reach the goal. They are an inseparable part of any business, and the success of an enterprise often depends on ability to solve all problems effectively. The process of problem solving often uses rational approach, helping to find a suitable solution. Using Fishbone Diagrams for Problem Solving is a productive and illustrative tool to identify the most important factors causing the trouble. ConceptDraw DIAGRAM extended with Fishbone Diagrams solution from the Management area of ConceptDraw Solution Park is a powerful tool for problem solving with Fishbone Ishikawa diagram graphic method.SWOT Matrix
SWOT matrix is a structured planning method used to evaluate the strengths, weaknesses, opportunities and threats involved in a project or in a business venture. ConceptDraw DIAGRAM diagramming and vector drawing software extended with SWOT and TOWS Matrix Diagrams Solution from the Management Area will help you design SWOT Matrix of any complexity quick and easy.Property Management Examples
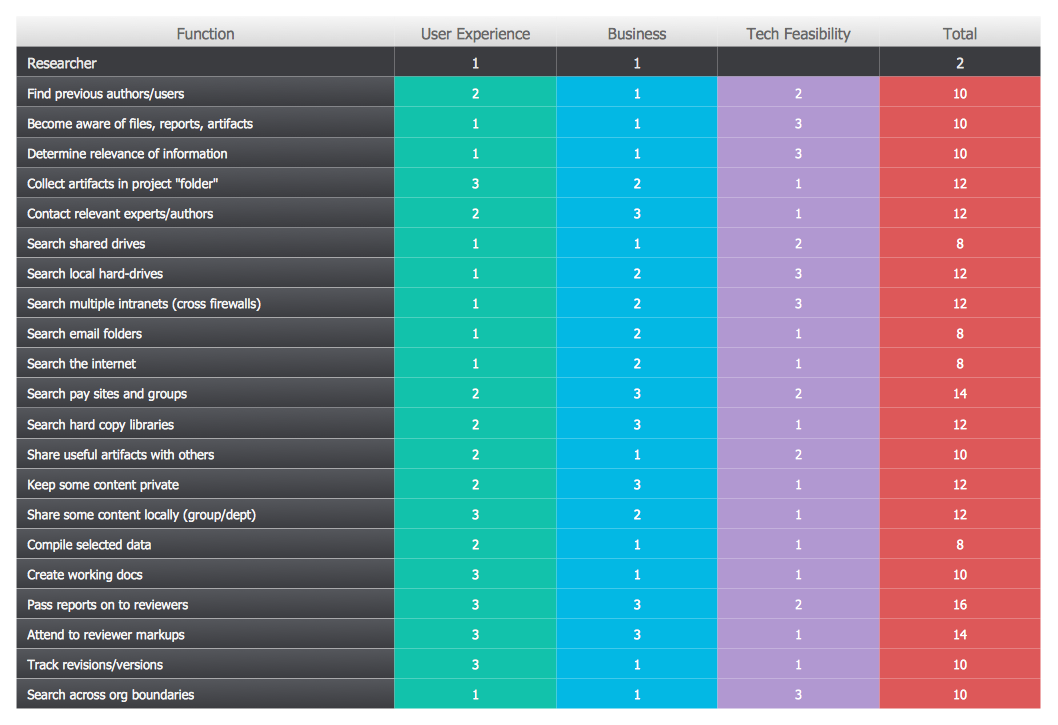
This sample was created in ConceptDraw DIAGRAM diagramming and vector drawing software using the Seven Management and Planning Tools Solution from the Business Productivity area of ConceptDraw Solution Park. This sample shows the Property Management matrix, the ideas are ordered in regards to importance and frequency. This matrix gives the ability to turn the theory into quantifiable data.Orgchart
Workforce planning is strategically important for each company, organization, enterprise, and corporation, non important it is business, commercial, non-profit or government organization. Organizational Chart or Orgchart is a type of diagram that is successfully used to graphically illustrate the structure of an organization and also relationships between its parts. There are three different types of Orgcharts: hierarchical, matrix and flat. ConceptDraw DIAGRAM diagramming and vector drawing software supplied with Organizational Charts Solution from Management Area is the best for easy designing professional-looking Orgcharts. This solution provides you the predesigned samples and Organizational Chart library with ready-to-use vector objects required for Orgchart design. It also offers the most simple way of drawing - the possibility to start with one of built-in Orgchart templates. Typically Orgcharts require for regular updating and making modifications, in ConceptDraw DIAGRAM it is fast and easy, the blocks are editable and remain connected when they are moved.- SWOT Matrix Template | SWOT Analysis Solution - Strategy Tools ...
- PROBLEM ANALYSIS. Prioritization Matrix | SWOT Matrix Template ...
- PROBLEM ANALYSIS. Prioritization Matrix
- Prioritization matrix - Health care problems | Seven Management ...
- PROBLEM ANALYSIS. Prioritization Matrix
- Prioritization Matrix | PROBLEM ANALYSIS. Root Cause Analysis ...
- PROBLEM ANALYSIS. Prioritization Matrix | Authority Matrix ...
- Prioritization matrix
- PROBLEM ANALYSIS. Prioritization Matrix | PROBLEM ANALYSIS ...
- How To Create an Involvement Matrix | SWOT Matrix Template ...
- PROBLEM ANALYSIS. Prioritization Matrix | Prioritization matrix ...
- Decision Making | PROBLEM ANALYSIS. Prioritization Matrix ...
- PROBLEM ANALYSIS. Prioritization Matrix | Root Cause Analysis ...
- PROBLEM ANALYSIS. Prioritization Matrix | Prioritization Matrix ...
- PROBLEM ANALYSIS. Root Cause Analysis Tree Diagram ...
- PROBLEM ANALYSIS. Prioritization Matrix | Sales activity ...
- Prioritization matrix - Health care problems | Prioritization Matrix ...
- Prioritization Matrix | Seven Management and Planning Tools ...
- PROBLEM ANALYSIS. Prioritization Matrix | Business Productivity ...
- How To Create an Involvement Matrix | PROBLEM ANALYSIS ...


