8 Step Problem Solving
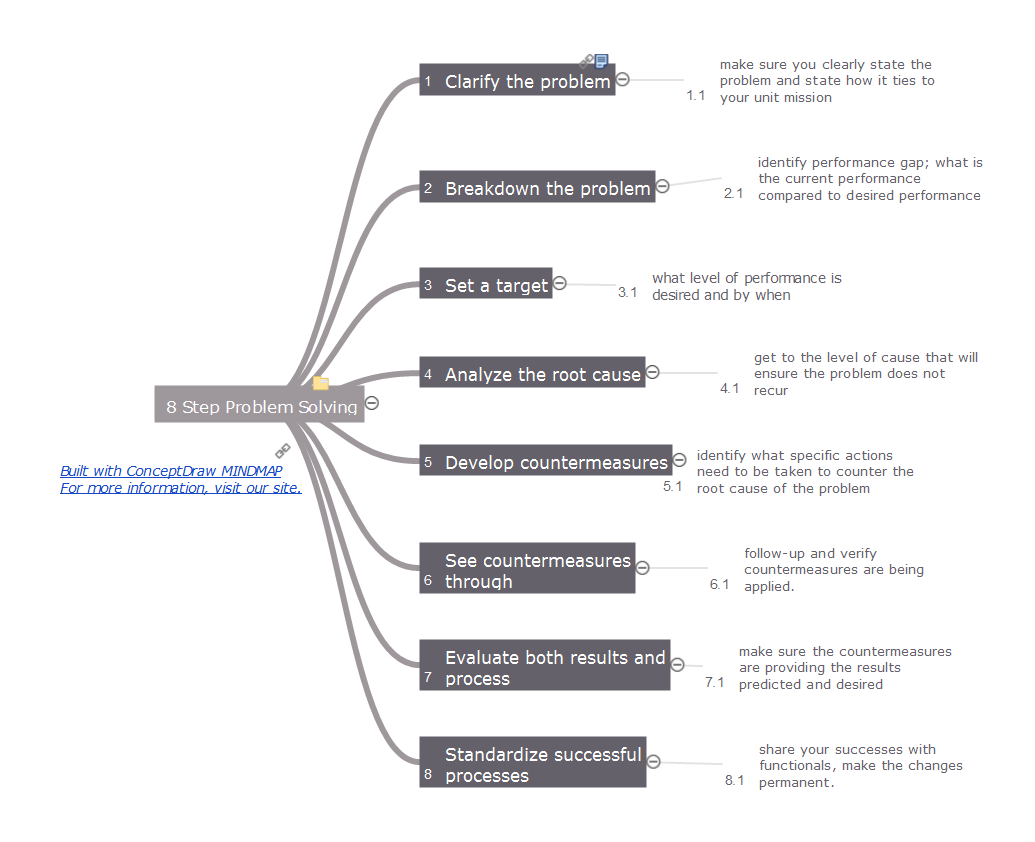
Time by time the problems appear in any field of our life and activities, and we can't to escape this. Any problem always has a certain content, the reasons and the circle of involved people. But the main task of any human, any organization, any company that was faced with a problem, is not to get lost and vice versa confidently look for the ways of solving this problem. The first you need to clarify the problem's essence, then to breakdown your problem and set a target. The most responsible step is to identify the cause-effect relationship, because each problem has its own root causes, and their detection will allow qualitatively solve this problem and avoid the similar problems in a future. Then you need to develop the countermeasures to counter the root cause of the problem and to make sure in their effectiveness, that they lead to the desired results. And finally standardize successful processes. This Mind Map designed with help of ConceptDraw MINDMAP software represents step-by-step the 8 steps approach of solving any kind of product or service problems.Process Flowchart
The main reason of using Process Flowchart or PFD is to show relations between major parts of the system. Process Flowcharts are used in process engineering and chemical industry where there is a requirement of depicting relationships between major components only and not include minor parts. Process Flowcharts for single unit or multiple units differ in their structure and implementation. ConceptDraw PRO is Professional business process mapping software for making Process flowcharts, Process flow diagram, Workflow diagram, flowcharts and technical illustrations for business documents and also comprehensive visio for mac application. Easier define and document basic work and data flows, financial, production and quality management processes to increase efficiency of your business with ConcepDraw PRO. Business process mapping software with Flowchart Maker ConceptDraw PRO includes extensive drawing tools, rich examples and templates, process flowchart symbols and shape libraries, smart connectors that allow you create the flowcharts of complex processes, process flow diagrams, procedures and information exchange. Process Flowchart Solution is project management workflow tools which is part ConceptDraw Project marketing project management software. Drawing charts, diagrams, and network layouts has long been the monopoly of Microsoft Visio, making Mac users to struggle when needing such visio alternative like visio for mac, it requires only to view features, make a minor edit to, or print a diagram or chart. Thankfully to MS Visio alternative like ConceptDraw PRO software, this is cross-platform charting and business process management tool, now visio alternative for making sort of visio diagram is not a problem anymore however many people still name it business process visio tools.
Context Diagram Template
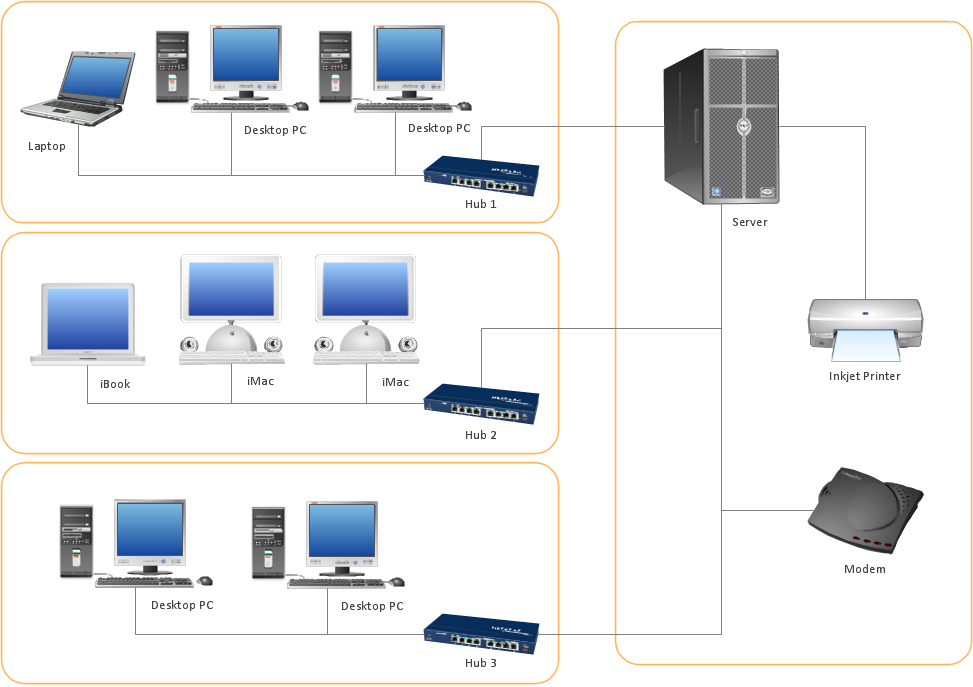
This template shows the Context Diagram. It was created in ConceptDraw PRO diagramming and vector drawing software using the Block Diagrams Solution from the “Diagrams” area of ConceptDraw Solution Park. The context diagram graphically identifies the system. external factors, and relations between them. It’s a high level view of the system. The context diagrams are widely used in software engineering and systems engineering for designing the systems that process the information.
Root Cause Tree Diagram
The Root Cause Tree Diagram is a chart that helps determine the root causes of factors that influence the problem, to represent and analyze them. This diagram is constructed separately for each high priority factor. First it is needed to identify the root causes for a factor, display their structure and then propose the possible corrective actions. But how to create Root Cause Tree Diagram with the least efforts and time? ConceptDraw MINDMAP will effectively help you in drawing MINDMAP Root Cause Tree Diagram and Root Cause Analysis Tree Diagram used for further formulation of actions. The Root Cause Tree Diagram template, which can be opened at the program from the Input tab, supplies you with a basic mind map structure for your diagram. The central idea describes briefly a problem, the main topics represent the high-level causes of a problem, their subtopics give more details about the different parts of given causes. At the last level of tree are described the potential solutions to each of detailed parts of the causes.How to Construct a Fishbone Diagram
Fishbone, Ishikawa or Cause and Effect diagram helps understand the reasons of completed or potential actions by structuring their causes in smaller categories. Also, one can use it to see how the contributing factors are related to each other. In everyday company routine, a Cause and Effect diagram is helpful with a number of regular activities like brainstorming, project management, and problem solving. How to Construct a Fishbone Diagram? Construction a Fishbone diagram in professional diagramming software ConceptDraw PRO is more easy than you think. Just use the predesigned vector elements from the Fishbone Diagrams library for Fishbone Diagrams solution or one of plenty Fishbone templates and examples, and you will get a Cause and Effect diagram in minutes.ConceptDraw Arrows10 Technology
Imagine the diagram which is looking smart. That is how ConceptDraw Arrows10 Technology or Smart connectors work. Thanks to auto-routing feature connectors flow around objects. But if you want some background objects that the connectors flow through - that is also possible to do.Affinity Diagram
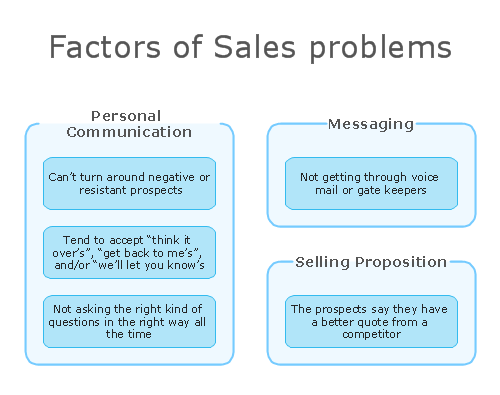
Affinity Diagram is a powerful business tool, one of the Seven Management and Planning Tools. It helps to gather and organize in groups the large number of information, opinions or ideas, which are typically generated during brainstorming session, and is based on the natural relationships that exist between ideas. Affinity Diagram is indispensible for analysis the complex problems, ideas and results of oral surveys. It effectively depicts the structure of large and complex factors that influence on a problem, divides them into smaller with simpler structure, but doesn't show a causal relationship between the factors. Typically Affinity Diagram contains approximately 40-50 topics and is widely used for a completely different goals, for the project definition, for analyzing product evaluations, for identifying the main violations in a process and the ways of their improvement. ConceptDraw Office applications are ideal for designing professional-looking Affinity diagrams. This Affinity diagram is created to prepare the data for further analysis of cause-and-effect relationships.Flowchart Components
The ConceptDraw Flowchart component includes a set of samples and templates. This geathered as flowchart maker toolbox which focused on drawing flowcharts of any industry standards.Relations Diagram
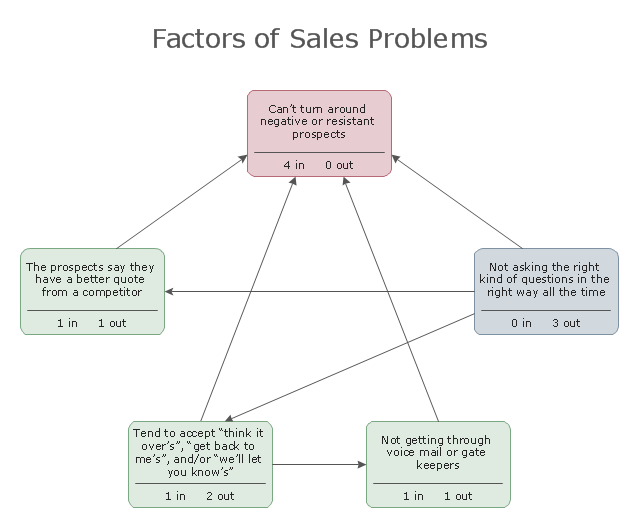
The Relations Diagram is used to identify how the factors influence each other, to determine what factors are causes and what are effects. The factors mostly influencing are called “drivers”, the primarily affected factors are “indicators”. The problem solving is focused on the change of "drivers" factors by applying the corrective actions. The "indicators" factors help establish the Key Performance Indicators (KPIs) to monitor the changes and also define the effectiveness of the corrective actions in resolving a problem. ConceptDraw MINDMAP software ideally suits for designing Relations Diagrams. The easiest way to create the MINDMAP Relations Diagram, is to use the included Relations Diagram input template. Open it in ConceptDraw MINDMAP application from the Input tab and hold a new brainstorming session, identify the central issue and the contributing factors to this issue. Click the Finish Brainstorm button to generate a Mind Map and begin the further work with it, or select Relations Diagram item from the Output tab to automatically draw it in ConceptDraw PRO application.Data Flow Diagram (DFD)
A Data Flow Diagram (DFD) illustrates the flow of data through an information system, visualizes how the information is handled in terms of inputs and outputs, how the data enter to system and leave it. It is effective to use a Data Flow Diagram for creation the system's overview, to show the system's scope and boundaries. There are two different types of notations for DFDs: Yourdon-Coad and Gane-Sarson, which differ in visual representations for processes, data flow, data stores, external entities, etc. Thus, for example the processes are depicted as circles in Yourdon-Coad notation and as rounded squares in Gane-Sarson notation. Gane-Sarson notation is usually used for visualization information systems and Yourdon-Coad - for system analysis and design. The Data Flow Diagrams solution included to Software Development area of ConceptDraw Solution Park offers a lot of DFD templates, samples and examples, libraries of vector stencils for construction without efforts the DFDs according to both Gane-Sarson and Yourdon-Coad notations.Affinity Diagram
The Affinity Diagram, also known as a KJ diagram, is a business tool invented for organization the large quantity of ideas and data. It is a part of Seven Management and Planning Tools, it is usually used right after brainstorming to sort large numbers of ideas into the corresponding groups. The Affinity Diagram helps to represent in a better way the structure of large and complex factors which influence on a problem, divides these factors into the smaller and simpler structures, and helps team members to see the patterns and identify possible solutions to problems they have. The diagrams of this type don't show the causal relationships between the factors, but they are designed to prepare the data for holding further analysis of the cause-effect relationships. Another area of Affinity Diagram usage is contextual inquiry as a way to sort observations and notes from field interviews, support call logs, open-ended survey responses organizing, etc. ConceptDraw MINDMAP software offers you the tools for easy holding brainstorming, generation ideas and creation MINDMAP Affinity Diagram.Relations Diagram
Relations Diagram was first used in electronics industry with a goal to find the key words and phrases in a text, and now is used in variety of fields. Relations Diagram defines visually the complex relationships between different elements and uses the boxes to represent these elements and the arrows to show the links. Relations Diagram allows the most extensively consider the problems, to represent visually relationships between the factors, processes, areas. It can be effective in organizing the diversity of ideas generated during the brainstorming session, lets identify the causes factors called "Drivers" and effects factors called "Indicators", detect such important characteristics as Key Performance Indicators that help to monitor the changes and effectiveness of corrective actions in the process of problem solving. ConceptDraw MINDMAP and ConceptDraw PRO applications that are included to ConceptDraw suite, offer a lot of useful tools that help perform the brainstorm session and easy design Relations Diagram. To make effectively Relations Diagram simply identify the problem, capture the issues, draw the arrows and count the influencers.Communication Tool for Remote Project Management
Communication is the main challenge and the key success factor for remote project management. Communicating visually via Skype you bring all team and customers onto the one page. Remote Presentation for Skype solution for ConceptDraw MINDMAP helps communicate with remote team and customers in visual manner on wide range of issues. Using this solution for regular status meetings allows you to push your team on tasks and keep task statuses up to date.Basic Audit Flowchart. Flowchart Examples
This sample shows the Audit Process Flowchart. It was created in ConceptDraw PRO diagramming and vector drawing software using the Flowcharts solution from the Diagrams area of ConceptDraw Solution Park. The Audit Flowcharts are widely used in the financial management, accounting, money management and in many others fields.Idea Outline
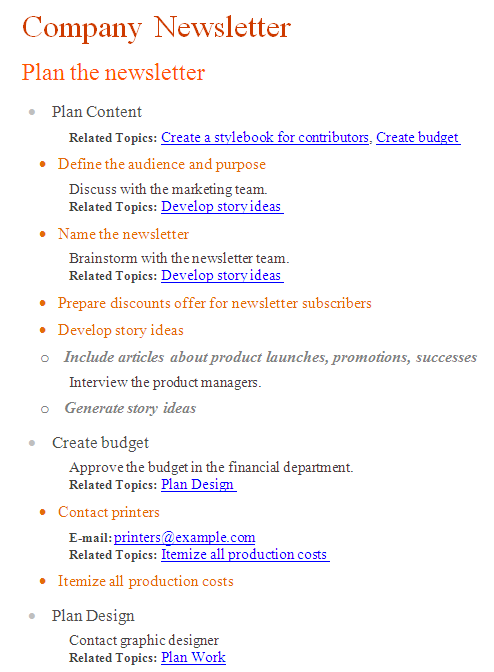
ConceptDraw MINDMAP is a powerful brainstorming software, the best application for ideas communication, for outlining ideas and data, for organizing arguments and other information. ConceptDraw MINDMAP software and solutions offered by ConceptDraw Solution Park help to hold the brainstorming session, to brainstorm a lot of new ideas, to outline your ideas, to make the Mind Map from the new ideas and concepts, to show new ideas at the presentation, efffectively communicate them and report at the meetings and conferences. The good ideas outline saves your time and helps visually explain your ideas for other people. Outline effectively your ideas using varied tools offered by ConceptDraw MINDMAP and make sure that it is very easy. The wide export capabilities of ConceptDraw MINDMAP are also helpful for ideas communication and collaboration with colleagues which don't have installed ConceptDraw Office applications. You can create automatically the MS PowerPoint presentation or MS Word document from the content of the active page of your map with a simple click.- Root cause analysis tree diagram - Template
- Fault Tree Analysis Diagrams | PROBLEM ANALYSIS. Root Cause ...
- Fishbone Diagram Problem Solving | Using Fishbone Diagrams for ...
- Influence Diagram | PROBLEM ANALYSIS. Root Cause Analysis ...
- Root Cause Tree Diagram | How To Create Root Cause Analysis ...
- Examples Of Outline Process Chart In Manufacturing Field
- Root Cause Tree Diagram | PROBLEM ANALYSIS. Root Cause ...
- Root cause analysis tree diagram - Template | Fault Tree Analysis ...
- Bar Diagrams for Problem Solving . Create economics and financial ...
- PROBLEM ANALYSIS. Root Cause Analysis Tree Diagram | Root ...
- Solution Tree Of Project Management
- Root Cause Tree Diagram | Outline Process Chart Examples For ...
- Fault Tree Analysis Diagrams | Root Cause Tree Diagram | Fault ...
- Venn Diagram Examples for Problem Solving . Computer Science ...
- Root Cause Tree Diagram | Communication Tool for Remote Project ...
- Example Of Problem Tree And Objective Tree Tree Diagrams Pdf
- How To Create Root Cause Analysis Diagram Using ConceptDraw ...
- Library Process Solved By Outline Process Chart
- Positioning Map | SWOT analysis positioning matrix - Template ...
- Outline Vs Flow Process Chart
