 Decision Making
The Decision Making solution offers the set of professionally developed examples, powerful drawing tools and a wide range of libraries with specific ready-made vector decision icons, decision pictograms, decision flowchart elements, decision tree icons, decision signs arrows, and callouts, allowing the decision maker (even without drawing and design skills) to easily construct Decision diagrams, Business decision maps, Decision flowcharts, Decision trees, Decision matrix, T Chart, Influence diagrams, which are powerful in questions of decision making, holding decision tree analysis and Analytic Hierarchy Process (AHP), visual decomposition the decision problem into hierarchy of easily comprehensible sub-problems and solving them without any efforts.
Flowchart design. Flowchart symbols, shapes, stencils and icons
A flowchart is a type of diagram which represents an algorithm, process or workflow, displays the steps as boxes of various kinds and depicts their order by connecting them with arrows. Any business graphic document will be more colorful and understandable if will use professional-looking and visual diagrams and flowcharts. Flowchart design gives versatile presenting and explaining of the process. ConceptDraw PRO flowchart software enhanced with Flowcharts solution helps effectively make Flowchart Design. Use of predesigned flowchart symbols and bright color palette offers a fresh view and favorably distinguishes the flowcharts designed in ConceptDraw PRO from the black and white flowcharts on a paper. Preferably to use no more than three or four colors and apply identical for the same shape types. The best flowchart design can be achieved by starting with Flowchart template, or any of suitable ready examples or samples offered in ConceptDraw STORE, open one of them and enter the proper text into each Flowchart shape. Each symbol of the flowchart has a definition that can't be changed. This means that all flowcharts shapes can be grouped in according to their meaning. Users with ConceptDraw PRO flowchart software can style groups of symbols with close definitions by color sets chosen from complementary palette. Almost all workflows can be depicted as a flowchart. Colored diagrams are more light for perception of the certain information, this is part of flowchart design. Bright colors need to be used in the key points of Decision symbols, to focus attention on their importance for whole process flow.
Basic Flowchart Symbols and Meaning
Flowcharts are the best for visually representation the business processes and the flow of a custom-order process through various departments within an organization. ConceptDraw PRO diagramming and vector drawing software extended with Flowcharts solution offers the full set of predesigned basic flowchart symbols which are gathered at two libraries: Flowchart and Flowcharts Rapid Draw. Among them are: process, terminator, decision, data, document, display, manual loop, and many other specific symbols. The meaning for each symbol offered by ConceptDraw gives the presentation about their proposed use in professional Flowcharts for business and technical processes, software algorithms, well-developed structures of web sites, Workflow diagrams, Process flow diagram and correlation in developing on-line instructional projects or business process system. Use of ready flow chart symbols in diagrams is incredibly useful - you need simply drag desired from the libraries to your document and arrange them in required order. There are a few serious alternatives to Visio for Mac, one of them is ConceptDraw PRO. It is one of the main contender with the most similar features and capabilities.
CORRECTIVE ACTIONS PLANNING. Risk Diagram (PDPC)
Risk Diagram (PDPC) - ConceptDraw Office suite is a software for Risks Diagram making. This diagram identifies possible risks in accomplishing corrective actions. With the Risks Diagram, one analyzes each action separately in a tree of all actions and develops a preventive action in response of each potential obstacles or circumstances which may be a risk.
Fishbone Diagram
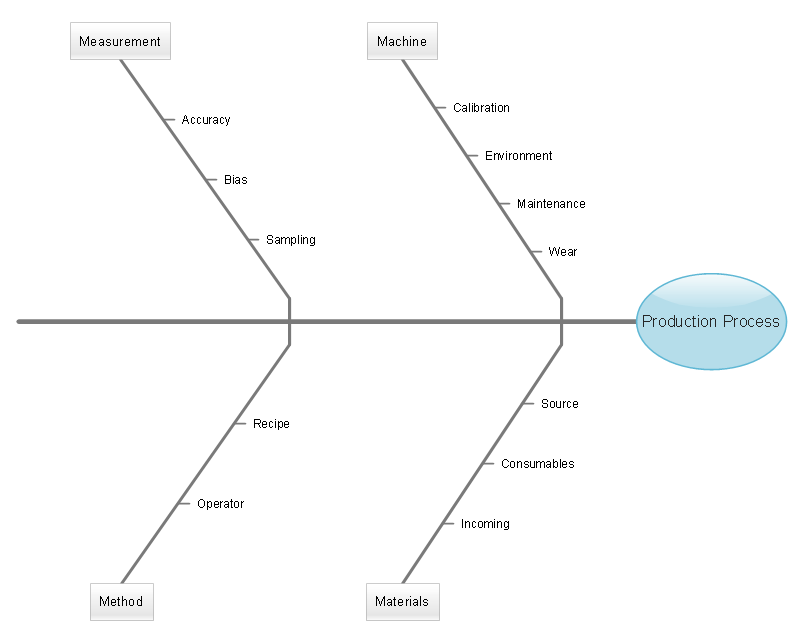
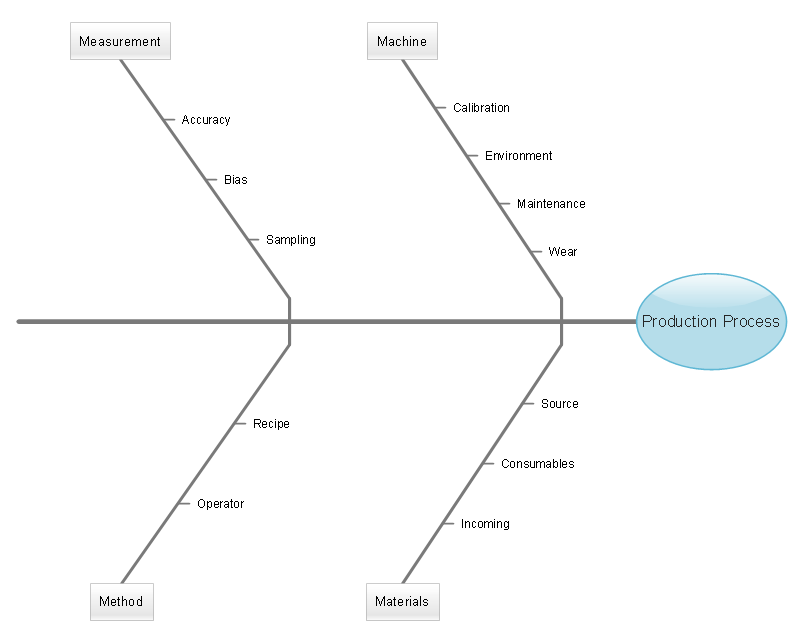
Fishbone diagram or Cause and Effect diagram resembles to the fish and is dedicated to representing of a single effect and multiple causes. Fishbone diagram is effective technique to determine the root causes and solve any problem or business task, identify the defects and eliminate them, detect the inefficiencies of a product or process, that's why Fishbone diagram is popular for using in business, product development, management, quality improvement, etc. It is well known that any problems begin from the head, so the first the Fishbone diagram includes the head that depicts a problem, task or question that is need to be analyzed. The bones on the fish body depict all causes, which contribute to the overall effect or a problem. Fishbone diagram is also sufficiently effective for visual organizing the causes that were defined during the brainstorming session. ConceptDraw MINDMAP application is a unique software with powerful capabilities of problem solving, holding brainstorming sessions, and drawing effective and professional-looking Fishbone diagrams.Fishbone Diagram
The use of specific types of visual diagrams is effective way to problems solving and decisions making. Fishbone diagram is a graphical tool used for visual and systematical analyzing the relationships between the solved problem and causes affecting its occurrence. It has hierarchical structure and that's why is well-suited for capturing in a mind map for a process of reviewing what branch is a real root cause of a given issue. ConceptDraw Office products and PM solutions offered by ConceptDraw STORE give the powerful help in questions of planning and project management. ConceptDraw PRO and ConceptDraw MINDMAP applications perfectly suit for designing professional-looking Fishbone Diagrams and allow effectively identify the root causes of quality issues using the Fishbone diagrams. The PM Response solution from the Project Management area of ConceptDraw Solution Park is powerful for improvement the response time to project changes, helps with iteration planning, with solving project challenges and discussing project layout approaches.Organizational Chart
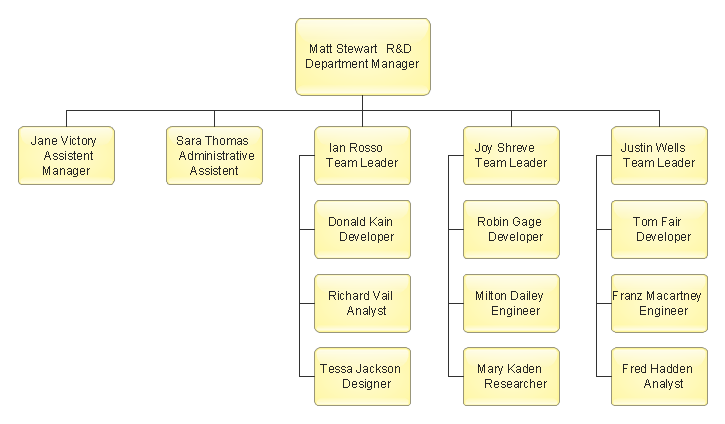
Organizational Chart is useful and perspective tool, which helps to illustrate the structure of an organization and relationships between personnel or departments. It is simple, but at the same time capacious graphical representation. ConceptDraw MINDMAP software is powerful in questions of brainstorming, designing Mind Maps and Organizational Charts, making professional presentations, building effective strategies, preparing documents and conducting meetings. ConceptDraw Office applications allow create Organizational Chart from your map in one click. Use numerous advantages of hierarchical tree structure of Mind Map when developing the organizational structure of your organization. Pay also attention on helpful Business Productivity solutions supported by ConceptDraw Solution Park, which assist managers and knowledge workers in making their jobs easier and save their time. The flexibility of ConceptDraw Office and the use of content that has already been developed and offered by ConceptDraw Solution Park as well as ability to repurpose it according to your requirements, help you effectively respond to any eventuality.
 Fishbone Diagrams
The Fishbone Diagrams solution extends ConceptDraw PRO v10 software with the ability to easily draw the Fishbone Diagrams (Ishikawa Diagrams) to clearly see the cause and effect analysis and also problem solving. The vector graphic diagrams produced using this solution can be used in whitepapers, presentations, datasheets, posters, and published technical material.
HelpDesk
How to Change the Font for an Entire Level of a Mind Map
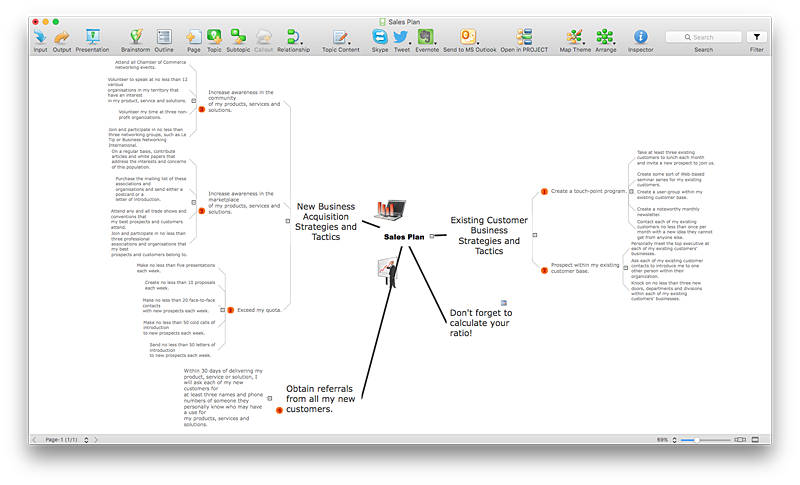
The visual representation of information is much more productive than simple linear transfer because it is more natural for our brain to understand information in the form of visual images. ConceptDraw MINDMAP will help you put your thoughts and ideas across to any audience in the most intelligible and memorable way. Mind maps can be used in a great number of situations involving analysis, learning, research and thinking. Use them for personal planning, preparing lists, working on projects, as well as analyzing problems and finding solutions. ConceptDraw MINDMAP provides a variety of style and formatting options for your mind maps, that let you add more information to your mind map without interfering with its readability.Authority Matrix Diagram Software
You need to draw Authority Matrix Diagram quick and easy? Design it with ConceptDraw PRO! ConceptDraw PRO extended with Seven Management and Planning Tools solution from the Management Area is the best Authority Matrix Diagram Software.- Root cause analysis tree diagram - Manufacturing problem solution ...
- PROBLEM ANALYSIS . Prioritization Matrix | Prioritisation Icon
- Risk Analysis Png Icon
- Strategic Planning Icon Png
- Cause and Effect Analysis | Problem solving | Using Fishbone ...
- Sales Flowcharts | The Action Plan | PROBLEM ANALYSIS ...
- Mind Map Problem Solving And Decision Making Total Quality
- Decision Making | Decision Making | Cause and Effect Analysis ...
- Expenses Icon Flat Png
- Management pictograms - Vector stencils library | Operations Icon ...


