PROBLEM ANALYSIS. Root Cause Analysis Tree Diagram
Root Cause Analysis Tree Diagram. Use the Root Cause Diagram to perform visual root cause analysis. Root Cause Analysis Tree Diagram is constructed separately for each highly prioritized factor. The goal of this is to find the root causes for the factor and list possible corrective action. ConceptDraw Office suite is a software for problem analysis.
Process Flowchart
The main reason of using Process Flowchart or PFD is to show relations between major parts of the system. Process Flowcharts are used in process engineering and chemical industry where there is a requirement of depicting relationships between major components only and not include minor parts. Process Flowcharts for single unit or multiple units differ in their structure and implementation. ConceptDraw PRO is Professional business process mapping software for making Process flowcharts, Process flow diagram, Workflow diagram, flowcharts and technical illustrations for business documents and also comprehensive visio for mac application. Easier define and document basic work and data flows, financial, production and quality management processes to increase efficiency of your business with ConcepDraw PRO. Business process mapping software with Flowchart Maker ConceptDraw PRO includes extensive drawing tools, rich examples and templates, process flowchart symbols and shape libraries, smart connectors that allow you create the flowcharts of complex processes, process flow diagrams, procedures and information exchange. Process Flowchart Solution is project management workflow tools which is part ConceptDraw Project marketing project management software. Drawing charts, diagrams, and network layouts has long been the monopoly of Microsoft Visio, making Mac users to struggle when needing such visio alternative like visio for mac, it requires only to view features, make a minor edit to, or print a diagram or chart. Thankfully to MS Visio alternative like ConceptDraw PRO software, this is cross-platform charting and business process management tool, now visio alternative for making sort of visio diagram is not a problem anymore however many people still name it business process visio tools.
Personal area (PAN) networks. Computer and Network Examples
Personal area network (PAN) is a network organized on a limited area and used for data transmission between various personal devices, such as computers, tablets, laptops, telephones, different digital and mobile devices, etc. and also for connecting to higher level network and Internet. PAN is used to manage the interconnections of IT devices which surround a single user and generally contains such appliances, as cordless mice, keyboard, phone, and Bluetooth handsets. PANs can be wired with computer buses, or wirelessly connected to the Internet using such network technologies as Bluetooth, Z-Wave, ZigBee, IrDa, UWB, Body Area Network. PANs have a lot of pros and cons, they are expedient, lucrative and handy, but sometimes have bad connection with other networks on the same radio bands, Bluetooth has distance limits and slow data transfer speed, but is comparatively safe. ConceptDraw PRO diagramming software supplied with numerous solutions of Computer and Networks Area included to ConceptDraw Solution Park perfectly suits for designing the Personal Area Networks.
Basic Flowchart Symbols and Meaning
Flowcharts are the best for visually representation the business processes and the flow of a custom-order process through various departments within an organization. ConceptDraw PRO diagramming and vector drawing software extended with Flowcharts solution offers the full set of predesigned basic flowchart symbols which are gathered at two libraries: Flowchart and Flowcharts Rapid Draw. Among them are: process, terminator, decision, data, document, display, manual loop, and many other specific symbols. The meaning for each symbol offered by ConceptDraw gives the presentation about their proposed use in professional Flowcharts for business and technical processes, software algorithms, well-developed structures of web sites, Workflow diagrams, Process flow diagram and correlation in developing on-line instructional projects or business process system. Use of ready flow chart symbols in diagrams is incredibly useful - you need simply drag desired from the libraries to your document and arrange them in required order. There are a few serious alternatives to Visio for Mac, one of them is ConceptDraw PRO. It is one of the main contender with the most similar features and capabilities.
 Fishbone Diagrams
The Fishbone Diagrams solution extends ConceptDraw PRO v10 software with the ability to easily draw the Fishbone Diagrams (Ishikawa Diagrams) to clearly see the cause and effect analysis and also problem solving. The vector graphic diagrams produced using this solution can be used in whitepapers, presentations, datasheets, posters, and published technical material.
PROBLEM ANALYSIS. Identify and Structure Factors
Identify and Structure Factors. Use the Affinity Diagram to collect and structure factors that impact on a problem. ConceptDraw Office suite is a software for identify and structure factors with affinity diagram. This is a grouping and structuring of factors that impact on a problem.
Samples of Flowchart
This sample shows the Flowchart of the testing the work of the lamp and decision making about what to do to lamp will work.Mind Map Making Software
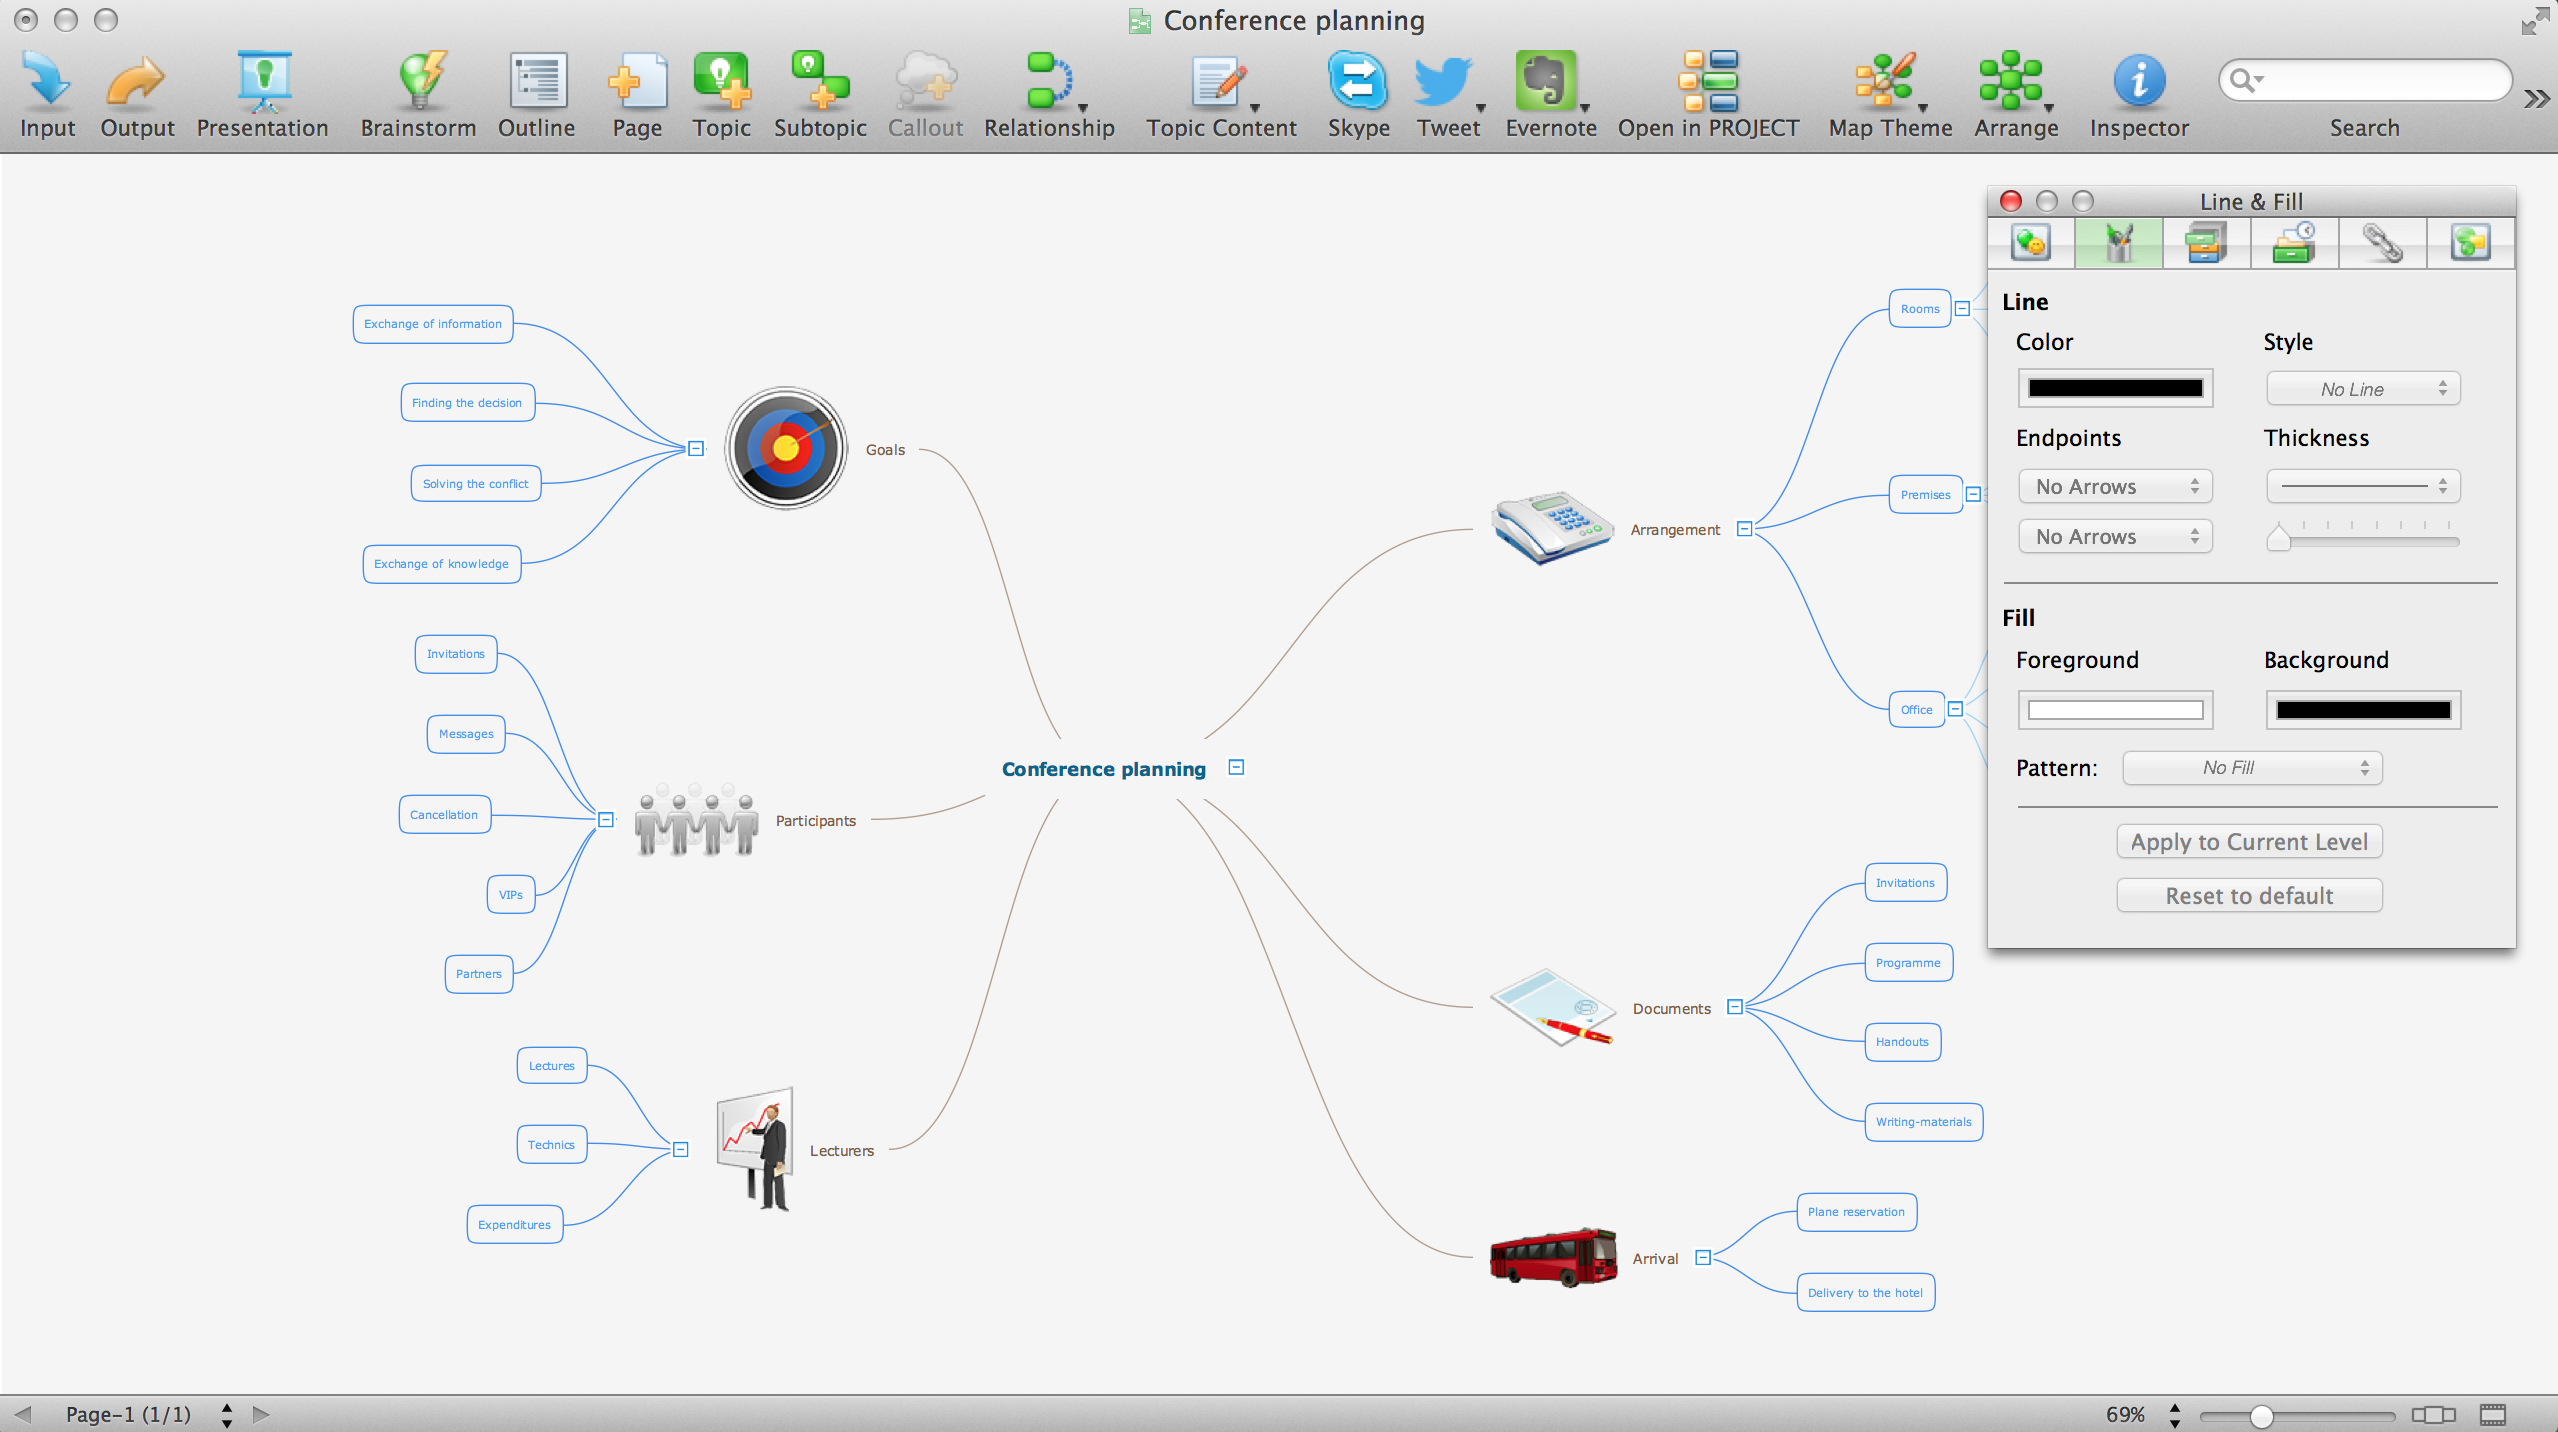
ConceptDraw MINDMAP is a powerful Mind Map making software, effective business and personal productivity application, which provides professional tools for thinking, brainstorming, generating and organizing ideas and data, for project planning, problem solving and many other tasks. ConceptDraw MINDMAP possess power, economy, and versatility, which help to raise personnel and team productivity. ConceptDraw MINDMAP allows you effectively generate, change, and update the Mind Maps. It provides variety of input and output solutions that allow create, change and share the Mind Maps quickly, simply and effectively. The use of desired Input template lets you create your own Mind Map in one moment. Discover today wide output and input capabilities of ConceptDraw MINDMAP. It lets to input the data from MS PowerPoint, MS Word, MS Project, XMind, MindManager, OPML and Text Outline sources, and also output your Mind Maps to MS PowerPoint, MS Word, MS Project, save as PDF, Web-page, Text Outline, RTF, OPML, or image.Activity Network Diagram Method
Activity Network Diagram - This sample was created in ConceptDraw PRO diagramming and vector drawing software using the Seven Management and Planning Tools solution from the Management area of ConceptDraw Solution Park. This sample shows the PERT (Program Evaluation Review Technique) chart of the request on proposal. A request for proposal (RFP) is a request of the company or the organization to potential suppliers to submit the business proposals for service or goods that it is interested to purchase. The RFP is represented on the initial procurement stage and allows to define the risks and benefits.Improving Problem Solving and Focus with Fishbone Diagrams
When you need to focus on the problem, professional diagramming tool helps you create a Fishbone diagram also known as Ishikawa diagram. Understanding of the problem via Fishbone diagram will improve the processes between departments and teams. ConceptDraw PRO extended with Fishbone Diagrams solution gives a powerful tool for improving problem solving and focus with Fishbone diagrams.8 Step Problem Solving
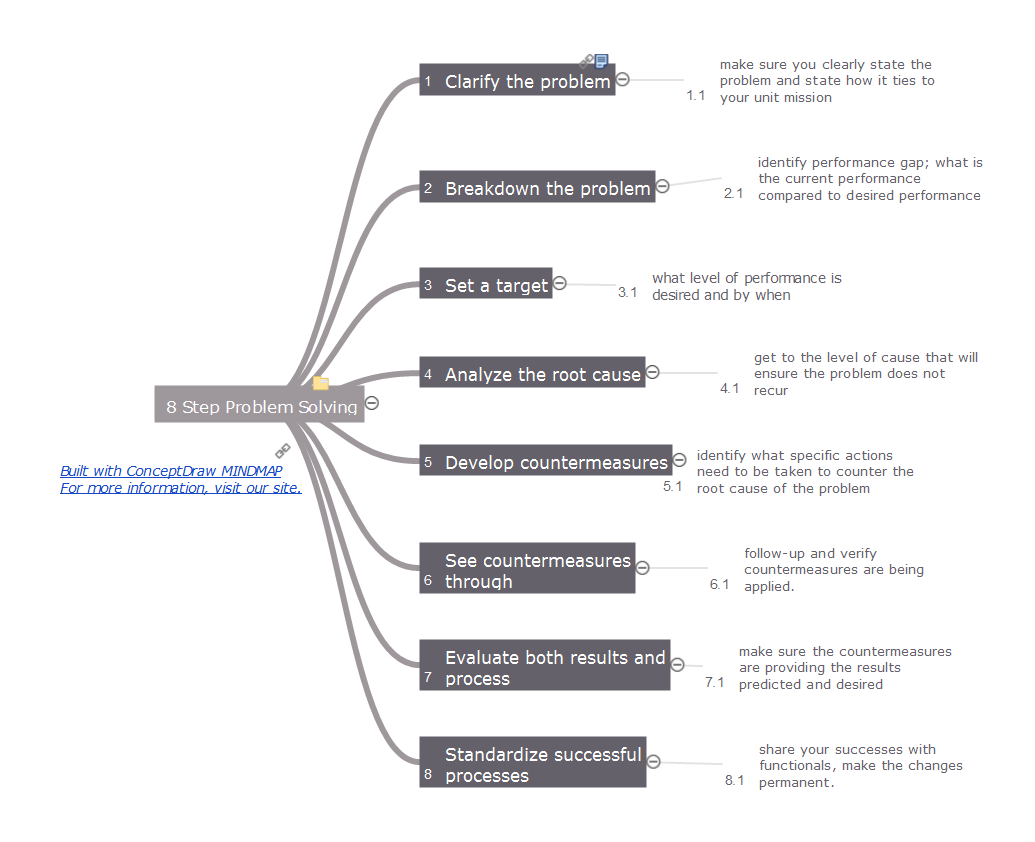
Time by time the problems appear in any field of our life and activities, and we can't to escape this. Any problem always has a certain content, the reasons and the circle of involved people. But the main task of any human, any organization, any company that was faced with a problem, is not to get lost and vice versa confidently look for the ways of solving this problem. The first you need to clarify the problem's essence, then to breakdown your problem and set a target. The most responsible step is to identify the cause-effect relationship, because each problem has its own root causes, and their detection will allow qualitatively solve this problem and avoid the similar problems in a future. Then you need to develop the countermeasures to counter the root cause of the problem and to make sure in their effectiveness, that they lead to the desired results. And finally standardize successful processes. This Mind Map designed with help of ConceptDraw MINDMAP software represents step-by-step the 8 steps approach of solving any kind of product or service problems.Rainfall Bar Chart
This sample shows the Horizontal Bar Chart of the average monthly rainfalls. This sample was created in ConceptDraw PRO diagramming and vector drawing software using the Bar Graphs Solution from the Graphs and Charts area of ConceptDraw Solution Park.
 Entity-Relationship Diagram (ERD)
Entity-Relationship Diagram (ERD) solution extends ConceptDraw PRO software with templates, samples and libraries of vector stencils from drawing the ER-diagrams by Chen's and crow’s foot notations.
Context Diagram Template
This template shows the Context Diagram. It was created in ConceptDraw PRO diagramming and vector drawing software using the Block Diagrams Solution from the “Diagrams” area of ConceptDraw Solution Park. The context diagram graphically identifies the system. external factors, and relations between them. It’s a high level view of the system. The context diagrams are widely used in software engineering and systems engineering for designing the systems that process the information.
Root Cause Tree Diagram
The Root Cause Tree Diagram is a chart that helps determine the root causes of factors that influence the problem, to represent and analyze them. This diagram is constructed separately for each high priority factor. First it is needed to identify the root causes for a factor, display their structure and then propose the possible corrective actions. But how to create Root Cause Tree Diagram with the least efforts and time? ConceptDraw MINDMAP will effectively help you in drawing MINDMAP Root Cause Tree Diagram and Root Cause Analysis Tree Diagram used for further formulation of actions. The Root Cause Tree Diagram template, which can be opened at the program from the Input tab, supplies you with a basic mind map structure for your diagram. The central idea describes briefly a problem, the main topics represent the high-level causes of a problem, their subtopics give more details about the different parts of given causes. At the last level of tree are described the potential solutions to each of detailed parts of the causes.- Image Of A Flowchart For Solving A Given Problem
- Images Of Fishborn Diagram With Example
- Images Of Fishbone Diagram
- Fishbone Methodology Hd Images
- Bar Diagrams for Problem Solving . Create space science bar charts ...
- Bar Diagrams for Problem Solving . Create space science bar charts ...
- Computer Science Chrt Digrram Images
- Fishbone Diagram | Fishbone Diagrams | Improving Problem ...
- Types Of Bargraphs Images Hd
- Basic Flowchart Symbols and Meaning | Basic Flowchart Images ...
- Flowchart Hr Images
- Problem Solution Diagram Pictures
- Images Of Double Bar Graph
- Basic Flowchart Images . Flowchart Examples | Manufacturing and ...
- Bar Diagrams for Problem Solving . Create economics and financial ...
- Influence Diagram | PROBLEM ANALYSIS. Root Cause Analysis ...
- Images Of Graphical Representation Of Bar Graphs
- Some Images Of Natural Resource Mabagement And Some Bar Graph
- Images Of Venn Diagrams
- Manufacturing Pictures Diagram


