The vector stencils library "Control chart" contains 8 Shewhart chart templates.
Use it to design your process-behavior charts with ConceptDraw PRO diagramming and vector drawing software.
"Control charts, also known as Shewhart charts (after Walter A. Shewhart) or process-behavior charts, in statistical process control are tools used to determine if a manufacturing or business process is in a state of statistical control. ... The control chart is one of the seven basic tools of quality control." [Control chart. Wikipedia]
The templates example "Design elements - Control chart" is included in the Seven Basic Tools of Quality solution from the Quality area of ConceptDraw Solution Park.
Shewhart chart (process-behavior chart) templates
-templates-design-elements---control-chart.png--diagram-flowchart-example.png)
This example was redesigned from the Wikimedia Commons file: Xbar chart for a paired xbar and R chart.svg.
"Example xbar chart for a process that experienced a 1.5σ drift starting at midnight." [commons.wikimedia.org/ wiki/ File:Xbar_ chart_ for_ a_ paired_ xbar_ and_ R_ chart.svg]
This file is licensed under the Creative Commons Attribution-Share Alike 3.0 Unported license.[creativecommons.org/ licenses/ by-sa/ 3.0/ deed.en]
"A control chart: process output variable is modeled by a probability density function and for each statistic of the sample an upper control line and lower control line are fixed, when the statistic moves out of bounds, an alarm is given and possible causes are investigated. In this drawing the statistic of choice is the mean and red points represent alarm points." [Operations management. Wikipedia]
The "Control chart example" was created using the ConceptDraw PRO software extended with the Seven Basic Tools of Quality solution from the Quality area of ConceptDraw Solution Park.
Shewhart chart (process-behavior chart) example
-example-control-chart-example.png--diagram-flowchart-example.png)
This example was redesigned from the Wikimedia Commons file: Xbar chart for a paired xbar and R chart.svg.
"Example xbar chart for a process that experienced a 1.5σ drift starting at midnight." [commons.wikimedia.org/ wiki/ File:Xbar_ chart_ for_ a_ paired_ xbar_ and_ R_ chart.svg]
This file is licensed under the Creative Commons Attribution-Share Alike 3.0 Unported license.[creativecommons.org/ licenses/ by-sa/ 3.0/ deed.en]
"A control chart: process output variable is modeled by a probability density function and for each statistic of the sample an upper control line and lower control line are fixed, when the statistic moves out of bounds, an alarm is given and possible causes are investigated. In this drawing the statistic of choice is the mean and red points represent alarm points." [Operations management. Wikipedia]
The "Control chart example" was created using the ConceptDraw PRO software extended with the Seven Basic Tools of Quality solution from the Quality area of ConceptDraw Solution Park.
"Example xbar chart for a process that experienced a 1.5σ drift starting at midnight." [commons.wikimedia.org/ wiki/ File:Xbar_ chart_ for_ a_ paired_ xbar_ and_ R_ chart.svg]
This file is licensed under the Creative Commons Attribution-Share Alike 3.0 Unported license.[creativecommons.org/ licenses/ by-sa/ 3.0/ deed.en]
"A control chart: process output variable is modeled by a probability density function and for each statistic of the sample an upper control line and lower control line are fixed, when the statistic moves out of bounds, an alarm is given and possible causes are investigated. In this drawing the statistic of choice is the mean and red points represent alarm points." [Operations management. Wikipedia]
The "Control chart example" was created using the ConceptDraw PRO software extended with the Seven Basic Tools of Quality solution from the Quality area of ConceptDraw Solution Park.
Shewhart chart (process-behavior chart) example
Basic Diagramming


Vertical Cross Functional Flowchart

Flow Chart Creator

What is a Cross Functional Flow Chart?
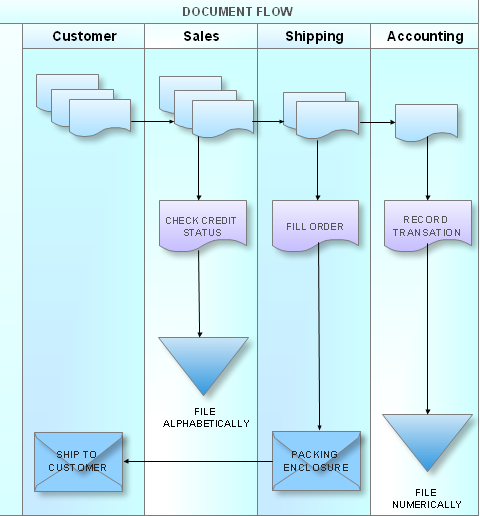
Cross-Functional Flowchart (Swim Lanes)

Cross Functional Flowchart for Business Process Mapping

Types of Flowcharts


- User Behavior Flow Chart
- Control chart example
- Design elements - Control chart
- Behavior Flow Chart Template
- Quality Control Chart Software — ISO Flowcharting | Flow chart ...
- Process Chart Svg
- Charts On Organisational Behaviour
- Organizational Behavior Flow Chart
- Chart Or Diagram Organisational Behaviour
- Flow Charts For Organizational Behaviour