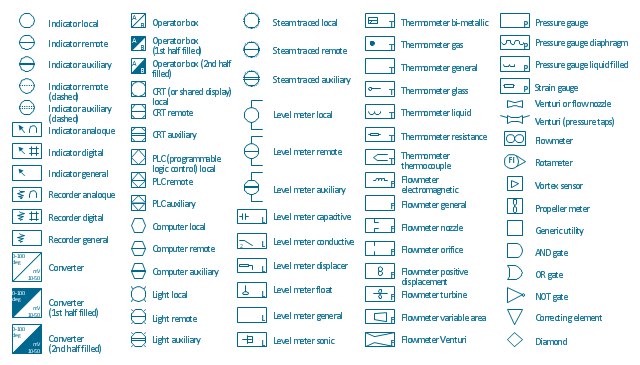
The vector stencils library "Instruments" contains 72 symbols of control instruments and measuring devices: meters and gauges, and callouts, text boxes, and inserts.
Use these shapes to create annotated process flow diagrams (PFD), flow control, manufacturing processes, and distribution system diagrams.
"Process control is an engineering discipline that deals with architectures, mechanisms and algorithms for maintaining the output of a specific process within a desired range.
Process control is extensively used in industry and enables mass production of continuous processes such as oil refining, paper manufacturing, chemicals, power plants and many other industries. Process control enables automation, with which a small staff of operating personnel can operate a complex process from a central control room." [Process control. Wikipedia]
The example "Design elements - Instruments" was created using the ConceptDraw PRO diagramming and vector drawing software extended with the Chemical and Process Engineering solution from the Engineering area of ConceptDraw Solution Park.
Process control instrument symbols
Basic Flowchart Symbols and Meaning


Process Flowchart


Probability Quality Control Tools

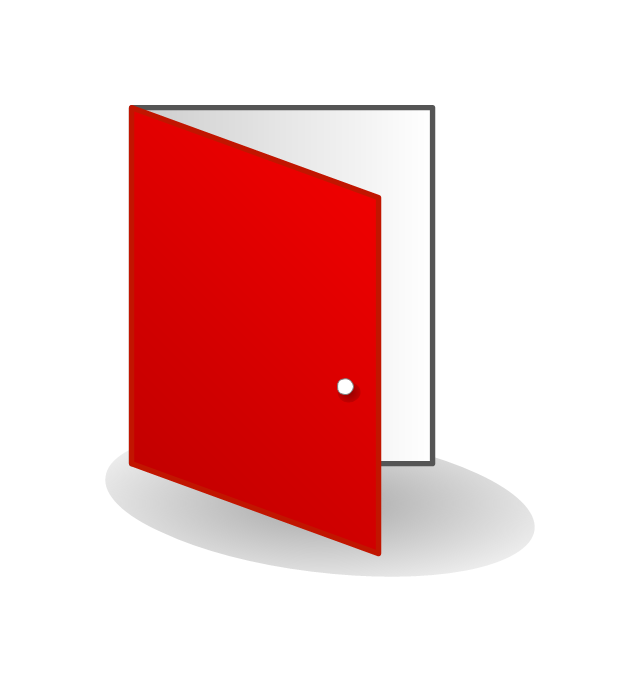
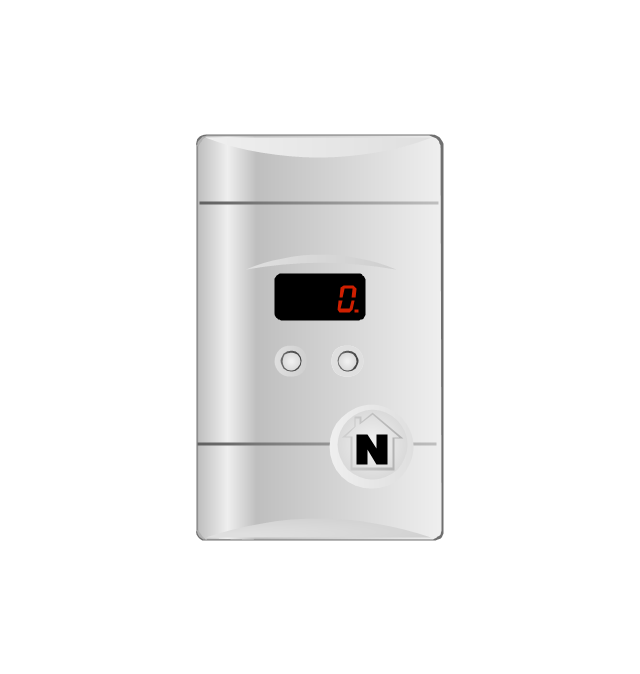
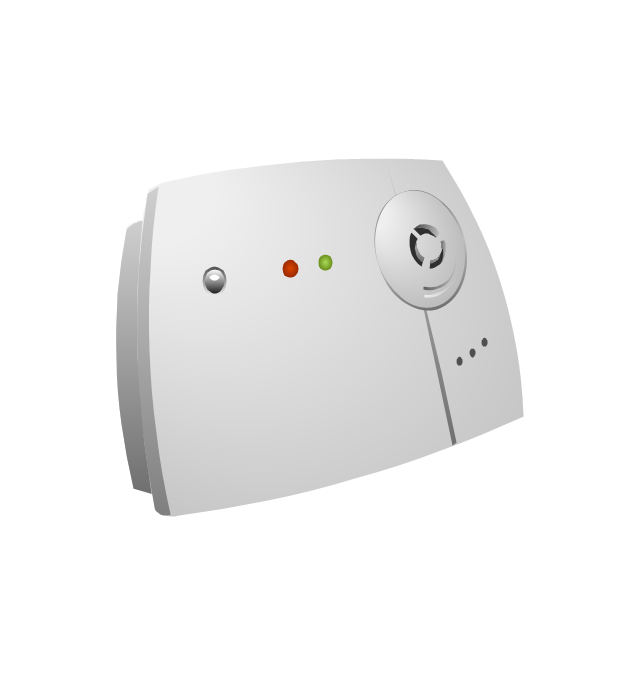
The vector stencils library "Fire safety equipment" contains 19 clipart images of fire safety equipment which you can easy use in your presentations and illustrations.
"Fire safety refers to precautions that are taken to prevent or reduce the likelihood of a fire that may result in death, injury, or property damage, alert those in a structure to the presence of an uncontrolled fire in the event one occurs, better enable those threatened by fire to survive in and evacuate from affected areas, or to reduce the damage caused by a fire. Fire safety measures include those that are planned during the construction of a building or implemented in structures that are already standing, and those that are taught to occupants of the building.
Threats to fire safety are referred to as fire hazards. A fire hazard may include a situation that increases the likelihood a fire may start or may impede escape in the event a fire occurs." [Fire safety. Wikipedia]
The clip art example "Fire safety equipment - Vector stencils library" was created in the ConceptDraw PRO diagramming and vector drawing software using the Presentation Clipart solution from the Illustration area of ConceptDraw Solution Park.
www.conceptdraw.com/ solution-park/ illustrations-presentation-clipart
Figure

Fire door
Alarm CO detector
Bell

CO detector
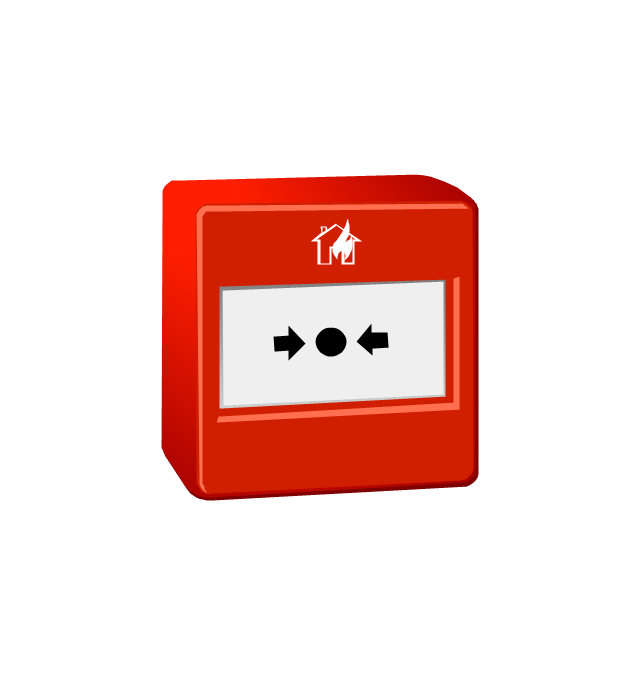
Manual call point
Smoke detector 2

Fire Alarm Siren

Loudspeaker

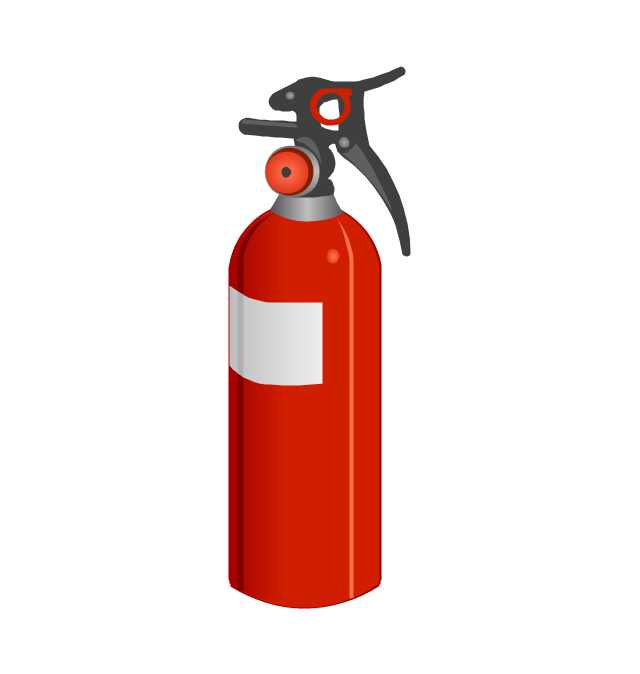
Fire extinguisher
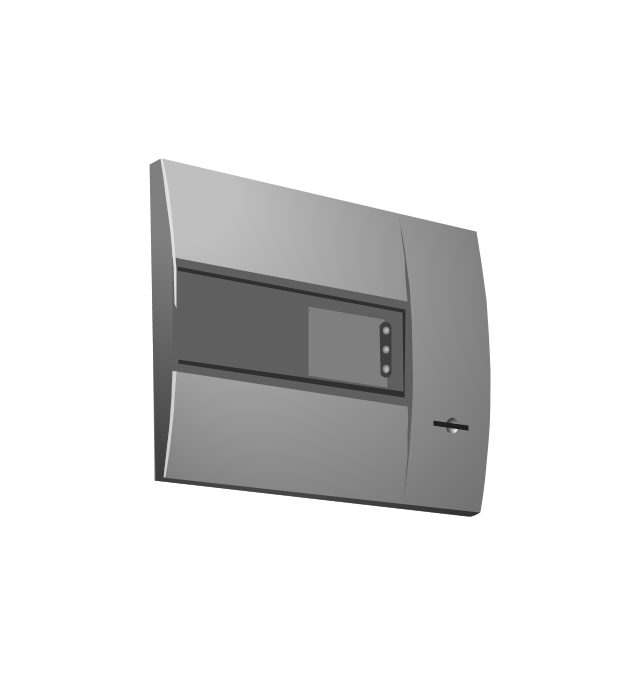
Fire alarm control panel
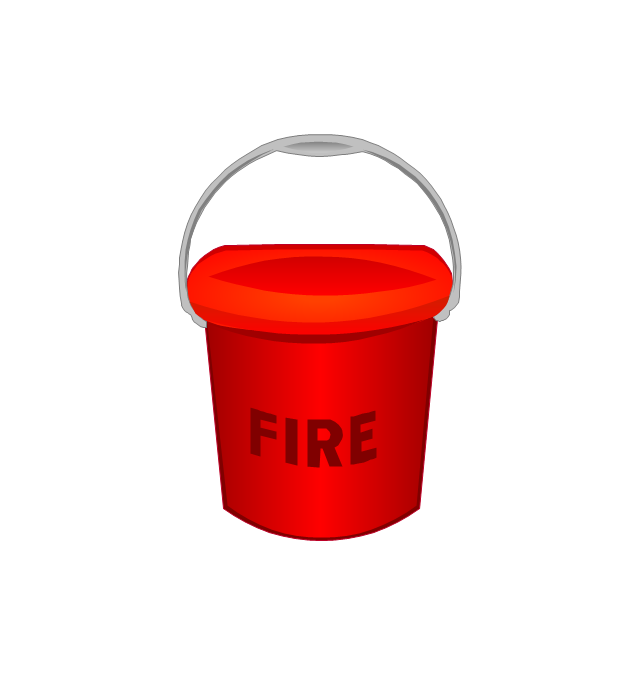
Fire bucket
High-resolution CCD digital camera
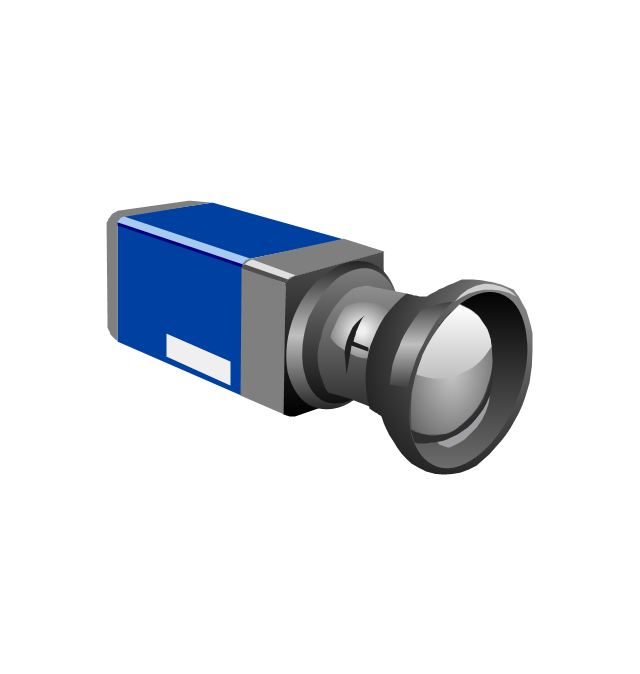
Infrared system for early fire detection
Infrared thermal imaging
Smoke detector
Security camera
Thermographic process control system
Beacon
The vector stencils library "Control chart" contains 8 Shewhart chart templates.
Use it to design your process-behavior charts with ConceptDraw PRO diagramming and vector drawing software.
"Control charts, also known as Shewhart charts (after Walter A. Shewhart) or process-behavior charts, in statistical process control are tools used to determine if a manufacturing or business process is in a state of statistical control. ... The control chart is one of the seven basic tools of quality control." [Control chart. Wikipedia]
The templates example "Design elements - Control chart" is included in the Seven Basic Tools of Quality solution from the Quality area of ConceptDraw Solution Park.
Shewhart chart (process-behavior chart) templates
-templates-design-elements---control-chart.png--diagram-flowchart-example.png)
 Event-driven Process Chain Diagrams
Event-driven Process Chain (EPC) Diagram is a type of flowchart widely used for modeling in business engineering and reengineering, business process improvement, and analysis. EPC method was developed within the Architecture of Integrated Information Systems (ARIS) framework.
The vector stencils library "Instruments" contains 72 symbols of control instruments and measuring devices: meters and gauges, and callouts, text boxes, and inserts.
Use these shapes to create annotated process flow diagrams (PFD), flow control, manufacturing processes, and distribution system diagrams.
"Process control is an engineering discipline that deals with architectures, mechanisms and algorithms for maintaining the output of a specific process within a desired range.
Process control is extensively used in industry and enables mass production of continuous processes such as oil refining, paper manufacturing, chemicals, power plants and many other industries. Process control enables automation, with which a small staff of operating personnel can operate a complex process from a central control room." [Process control. Wikipedia]
The example "Design elements - Instruments" was created using the ConceptDraw PRO diagramming and vector drawing software extended with the Chemical and Process Engineering solution from the Engineering area of ConceptDraw Solution Park.
Use these shapes to create annotated process flow diagrams (PFD), flow control, manufacturing processes, and distribution system diagrams.
"Process control is an engineering discipline that deals with architectures, mechanisms and algorithms for maintaining the output of a specific process within a desired range.
Process control is extensively used in industry and enables mass production of continuous processes such as oil refining, paper manufacturing, chemicals, power plants and many other industries. Process control enables automation, with which a small staff of operating personnel can operate a complex process from a central control room." [Process control. Wikipedia]
The example "Design elements - Instruments" was created using the ConceptDraw PRO diagramming and vector drawing software extended with the Chemical and Process Engineering solution from the Engineering area of ConceptDraw Solution Park.
Process control instrument symbols
Process Flow Diagram

Process Flow Chart

Total Quality Management Value

The vector stencils library "Fire safety equipment" contains 19 clipart images of fire safety equipment which you can easy use in your presentations and illustrations.
"Fire safety refers to precautions that are taken to prevent or reduce the likelihood of a fire that may result in death, injury, or property damage, alert those in a structure to the presence of an uncontrolled fire in the event one occurs, better enable those threatened by fire to survive in and evacuate from affected areas, or to reduce the damage caused by a fire. Fire safety measures include those that are planned during the construction of a building or implemented in structures that are already standing, and those that are taught to occupants of the building.
Threats to fire safety are referred to as fire hazards. A fire hazard may include a situation that increases the likelihood a fire may start or may impede escape in the event a fire occurs." [Fire safety. Wikipedia]
The clip art example "Fire safety equipment - Vector stencils library" was created in the ConceptDraw PRO diagramming and vector drawing software using the Presentation Clipart solution from the Illustration area of ConceptDraw Solution Park.
www.conceptdraw.com/ solution-park/ illustrations-presentation-clipart
"Fire safety refers to precautions that are taken to prevent or reduce the likelihood of a fire that may result in death, injury, or property damage, alert those in a structure to the presence of an uncontrolled fire in the event one occurs, better enable those threatened by fire to survive in and evacuate from affected areas, or to reduce the damage caused by a fire. Fire safety measures include those that are planned during the construction of a building or implemented in structures that are already standing, and those that are taught to occupants of the building.
Threats to fire safety are referred to as fire hazards. A fire hazard may include a situation that increases the likelihood a fire may start or may impede escape in the event a fire occurs." [Fire safety. Wikipedia]
The clip art example "Fire safety equipment - Vector stencils library" was created in the ConceptDraw PRO diagramming and vector drawing software using the Presentation Clipart solution from the Illustration area of ConceptDraw Solution Park.
www.conceptdraw.com/ solution-park/ illustrations-presentation-clipart
Figure
Fire door
Alarm CO detector
Bell
CO detector
Manual call point
Smoke detector 2
Fire Alarm Siren
Loudspeaker
Fire extinguisher
Fire alarm control panel
Fire bucket
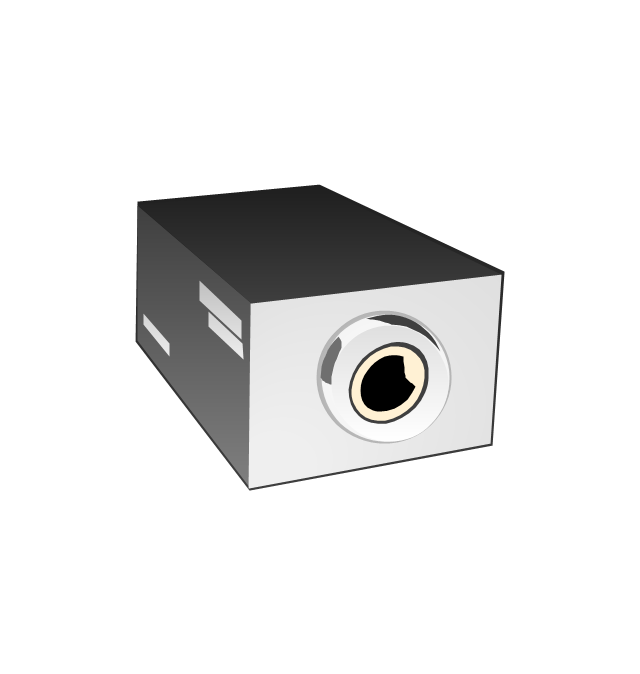
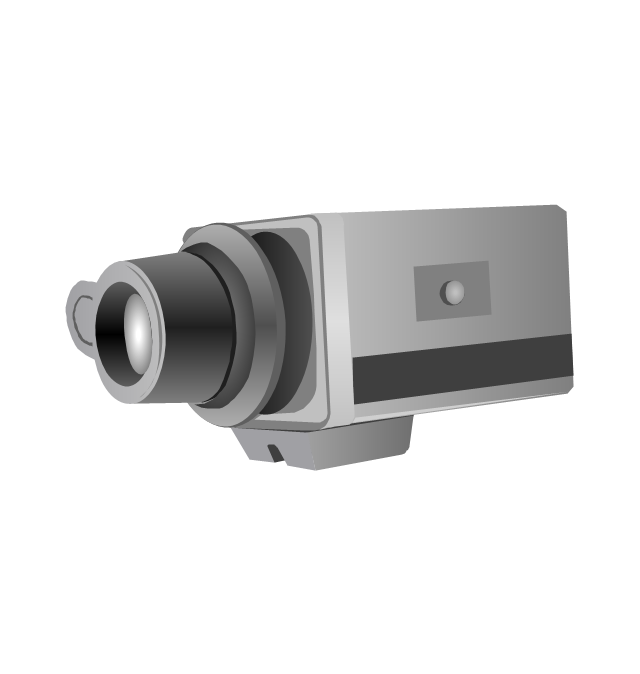
High-resolution CCD digital camera
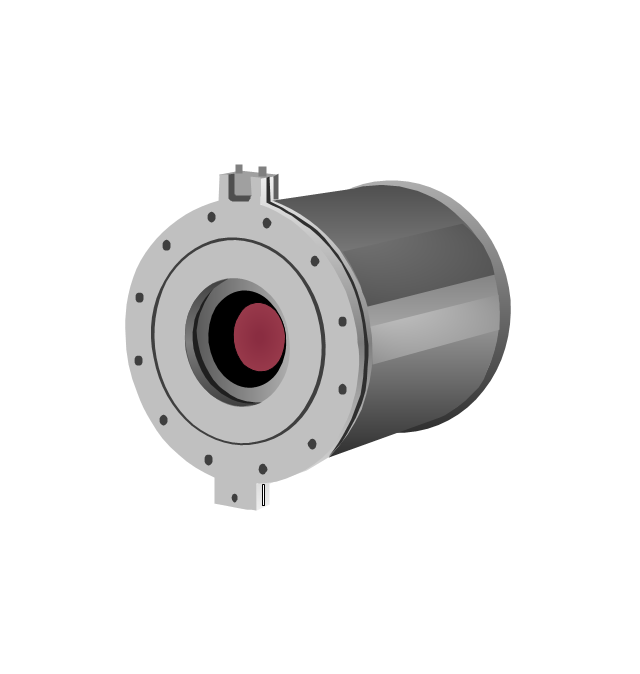
Infrared system for early fire detection
Infrared thermal imaging
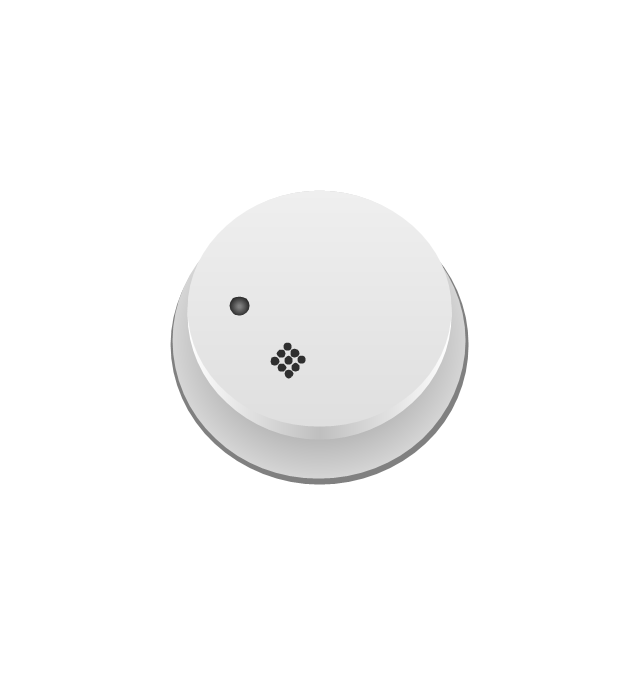
Smoke detector
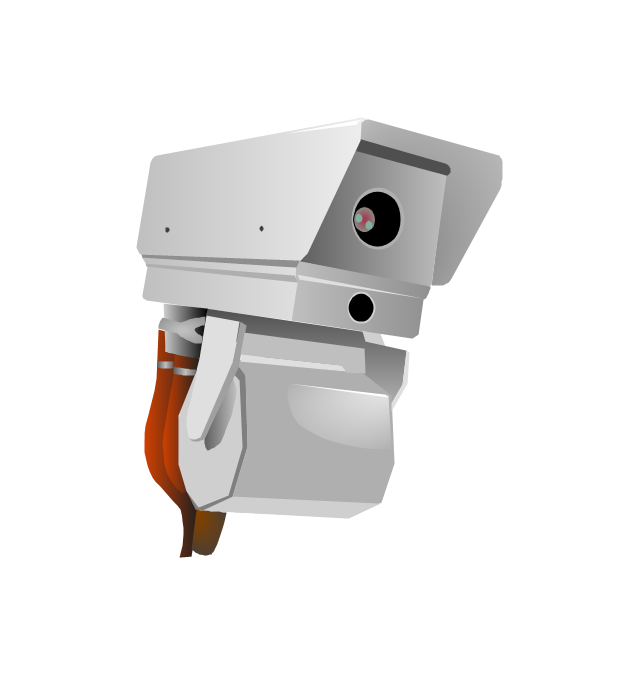
Security camera
Thermographic process control system
Beacon
Cross-Functional Flowchart


Business process Flow Chart — Event-Driven Process chain (EPC) diagrams
 diagram, Process flow diagram tool")
Quality Control Chart Software — ISO Flowcharting

- Process Control Symbol
- Symbol Used In Process Control
- Process Control Chart Symbols
- Process Control Flow Diagram
- Industrial Process Control Input Symbol
- Process Control Block Diagram
- Process Flow Diagram Symbols | Process Flowchart | Piping and ...
- Process Control System Schematic Diagram Of A Vertical Filtration ...
- HVAC Plans | IDEF4 Standard | Process Control Block Diagram For ...
- Chemical Engineering Process Control Symbols
- Control System Chemical Process Schematic Drawing
- Design elements - Control chart | Control chart example | Design ...
- Basic Flowchart Symbols and Meaning | Process Flowchart | Data ...
- Industrial Control Systems
- Control And Automation Symbols
- Process Control And Instrumentation Charts Pdf
- Total Quality Management Definition | Process Flowchart | TQM ...
- Interior Design Plumbing - Design Elements | Half Pipe Plans ...
- Process Flowchart | Internal Audit Process | Basic Flowchart ...
- Process Control Automation Diagram