 Event-driven Process Chain Diagrams
Event-Driven Process Chain Diagrams solution extends ConceptDraw DIAGRAM functionality with event driven process chain templates, samples of EPC engineering and modeling the business processes, and a vector shape library for drawing the EPC diagrams and EPC flowcharts of any complexity. It is one of EPC IT solutions that assist the marketing experts, business specialists, engineers, educators and researchers in resources planning and improving the business processes using the EPC flowchart or EPC diagram. Use the EPC solutions tools to construct the chain of events and functions, to illustrate the structure of a business process control flow, to describe people and tasks for execution the business processes, to identify the inefficient businesses processes and measures required to make them efficient.
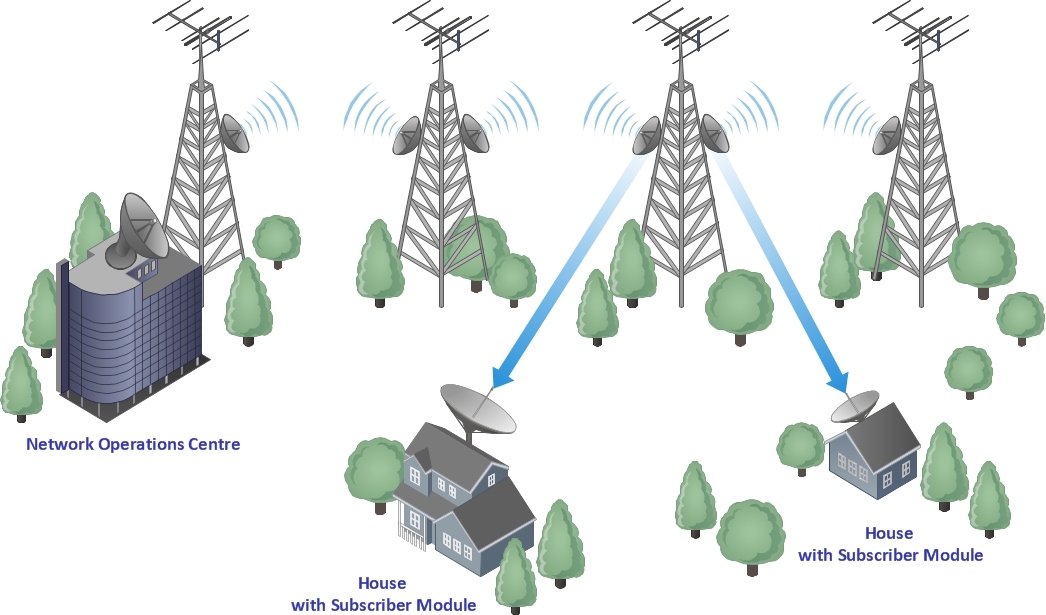
Illustrate the Computer Network of a Building
With best content of the Wireless Network solution that includes more than 10 building pre-designed objects network engineers can illustrate the computer network of a building.Business Diagram Software
When managing the projects, people, or networks, there are daily designed and used different types of Business diagrams, so the powerful drawing software will be very useful for this. ConceptDraw DIAGRAM with large quantity of business solutions will meet your needs and will help you convey your ideas successful and rapidly, no matter are you professional or beginner. It is the best choice for business specialists and technical professionals who need quickly and easily explore, visualize, and communicate information. ConceptDraw DIAGRAM business diagram software is the most powerful business software and relational charting software. Create advanced, completely customizable Business Process Diagrams, Business Flow Charts, Work Flow Diagrams, Organizational Charts, Audit diagrams, Marketing diagrams, Value Stream Maps, TQM diagrams, ERD diagrams, EPC diagrams, Cause and Effect diagrams, Infographics, Dashboards, and other Relational business diagrams from your data using the powerful drawing tools of ConceptDraw Solution Park.
 Value Stream Mapping
Value stream mapping solution extends ConceptDraw DIAGRAM software with templates, samples and vector stencils for drawing the Value Stream Maps (VSM) in lean manufacturing practice.
 Audio, Video, Media
Use it to make professional-looking documents, impressive presentations, and efficient websites with colorful and vivid illustrations and schematics of digital audio, video and photo gadgets and devices, audio video connections and configurations, S Video connection, HD and 3D television systems, home entertainment systems, Closed-circuit television (CCTV) surveillance systems. All audio video schematics, drawings and illustrations designed in ConceptDraw DIAGRAM are professional looking, clear and understandable for all thanks to applying the most commonly used standards of designations, and are effective for demonstrating in front of a small audience and on the big screens.
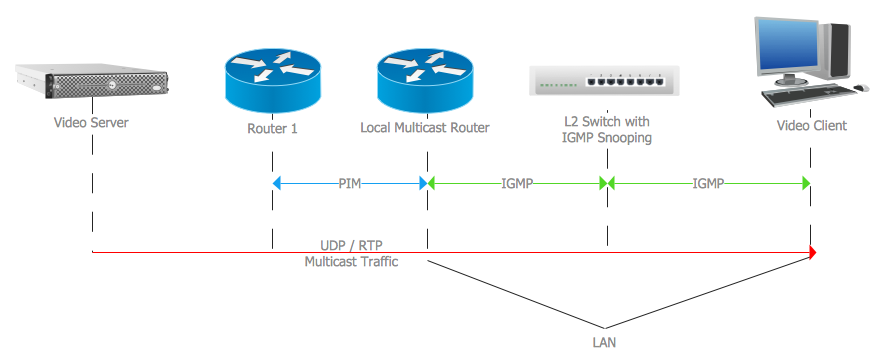
Internet Group Management Protocol (IGMP). Computer and Network Examples
The Internet Group Management Protocol (IGMP) is a communication protocol of the multicast transfer data in the IP networks. IGMP is used by routers and IP hosts for organizing the network devices in groups. This example was created in ConceptDraw DIAGRAM using the Computer and Networks solution from the Computer and Networks area of ConceptDraw Solution Park. It shows the architecture of the network for delivering a multicast service using IGMP.
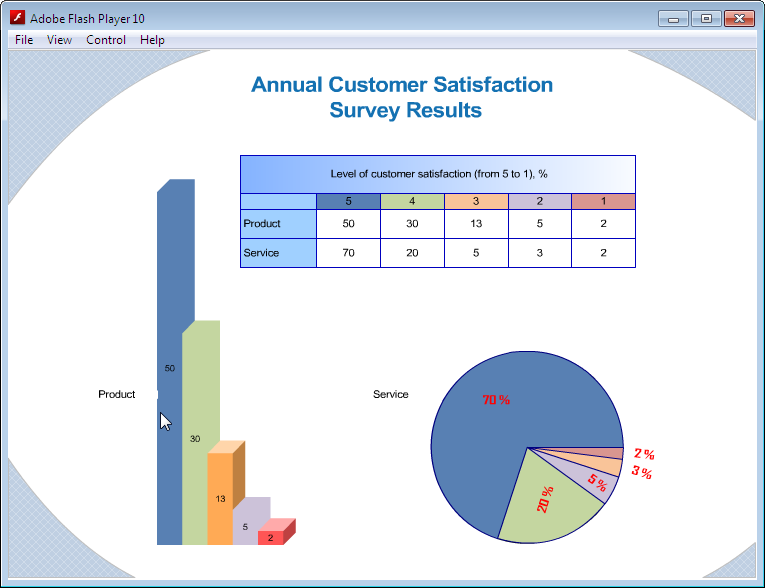
Export from ConceptDraw DIAGRAM Document to SWF (Adobe® Flash®) File
ConceptDraw DIAGRAM ’s has extensive export capabilities which allow you to export your drawing as MS PowerPoint® and Adobe PDF files. You can also embed a drawing into an HTML page after saving it in SWF or SVG formats.
 Azure Architecture
Azure Architecture solution bundles into one handy tool everything you need to create effective Azure Architecture diagrams. It adds the extra value to versatile ConceptDraw DIAGRAM software and extends the users capabilities with comprehensive collection of Microsoft Azure themed graphics, logos, preset templates, wide array of predesigned vector symbols that covers the subjects such as Azure management, Azure storage, and Azure services, amongst others, and allow you to illustrate Azure Architecture diagrams at any degree of complexity, to present visually your Azure cloud system architecture with professional style, to design Azure cloud topology, to document Windows Azure Architecture and Azure Cloud System Architecture, to visualize the great abilities and work of Microsoft Azure Cloud System and Azure services.
- Data Flow Diagram Streaming
- Data Flow Diagram For Video Streaming
- Production Process Flow Chart Video Creator Online
- Data Flow Chart For Online Video Streming
- Process Flowchart | Data Flow Diagram | How to Create Flowcharts ...
- Basic Flowchart Symbols and Meaning | Process Flowchart | Value ...
- Example of DFD for Online Store (Data Flow Diagram ) DFD ...
- Process Flowchart | Advertising creation process - Conversation ...
- Pro Video Stream Diagram
- Dfd Of Video Streaming
- Advertising creation process - Conversation BPMN 2.0 diagram ...
- Entity Relationship Diagram For Video Stream
- Advertising creation process - Conversation BPMN 2.0 diagram ...
- ER Diagram For Online Video Streming
- Flow chart Example . Warehouse Flowchart | Business Processes ...
- How to Create a VSM Diagram Using ConceptDraw Value Stream ...
- Flow chart Example . Warehouse Flowchart | Entity-Relationship ...
- Advertising creation process - Conversation BPMN 2.0 diagram ...
- What is the Accounting Cycle? | Process Flowchart | Best Value ...
- Bpmn Process Diagram


