Cross-Functional Flowchart
Use of Cross-Functional Flowchart is a clear way of showing each team member’s responsibilities and how processes get shared or transferred between different responsible people, teams and departments. Use the best flowchart maker ConceptDraw PRO with a range of standardized cross-functional flowchart symbols to create the Cross-Functional Flowcharts simply and to visualize the relationship between a business process and the functional units responsible for that process. To draw the most quickly Cross-Functional Flowcharts, Cross Functional Process Maps, or Cross Functional Process Flow Diagrams, start with a Cross-functional flowchart samples and templates from ConceptDraw Solution Park. The ConceptDraw Arrows10 and RapidDraw technologies will be also useful for you in drawing. ConceptDraw PRO supports designing both types - horizontal and vertical Cross-functional flowcharts. A vertical layout makes the accents mainly on the functional units while a horizontal layout - on the process. If you need a Visio alternative in Mac OS X, try ConceptDraw PRO. Its interface is very intuitive and it’s actually much easier to use than Visio, yet somehow it’s just as powerful if not more so. ConceptDraw PRO performs professional quality work and seamless Visio interaction.
Flow chart Example. Warehouse Flowchart
Warehouse Flowcharts are various diagrams that describe the warehousing and inventory management processes on the warehouses. Typical purposes of Warehouse Flowcharts are evaluating warehouse performance, measuring efficiency of customer service and organizational performance. This type of Workflow diagrams can be used for identifying any disconnection between business activities and business objectives. They are effectively used by warehouse-related people and organizations, manufacturers, wholesalers, exporters, importers, transporters, and others. Standard Warehousing process flow diagram and standard Workflow diagram are used for process identification for further evaluating effectiveness and profitability of overall business process. Use the ConceptDraw PRO vector graphic software extended with Flowcharts solution to design your own professional-looking Workflow diagrams and Flowcharts of any types, including the Warehouse flowchart, Process flow diagrams which depict in details all steps of Warehouse packages flow. Microsoft Visio, designed for Windows users, can’t be opened directly on Mac. But fortunately, there are several Visio alternatives for Mac which will help Mac users to work Visio files. With ConceptDraw PRO, you may open, edit and save files in Visio format.
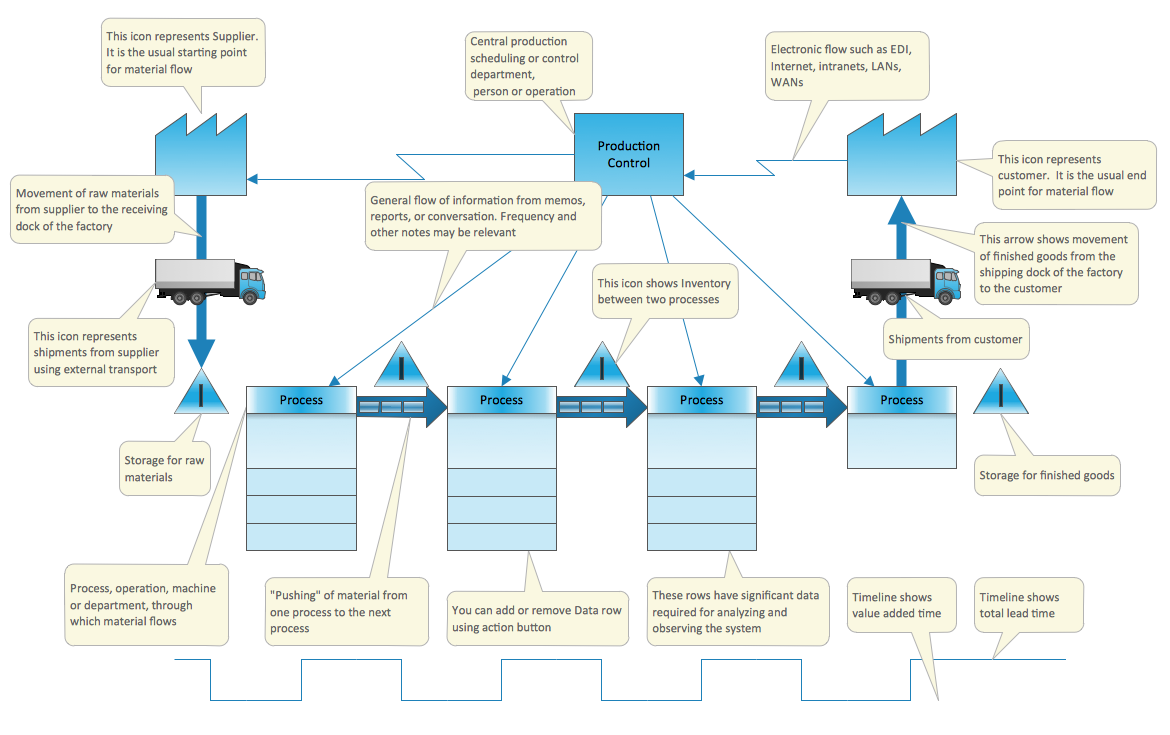
What is Value Stream Mapping?
Value stream maps (VSM) are an essential tool for organizations applying Lean methods.HelpDesk
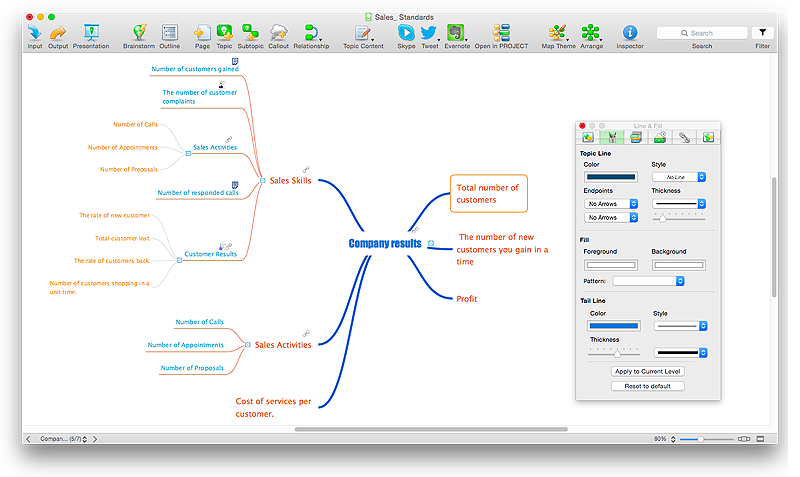
How to Customize the Default Map Theme
ConceptDraw MINDMAP allows you to customize all kinds of visual aspects of your mind maps, including the the style of topic lines of the default theme for new maps.SWOT Analysis
When starting a new business project or business venture and making the strategic decisions, you need to attach all strengths, utilize all opportunities to eliminate weaknesses and to avoid potential threats. All these actions look like hard, but it is not so when is applied a SWOT Analysis method. The main goal of this method is to help develop a strong business strategy, its major tools are SWOT Matrix and SWOT Mind Map that help you define the internal strengths and weaknesses, and also external opportunities and threats that you may face. The Mind Map is a unique visual tool, which lets you see immediately the key points and gaps, and to establish the links between seemingly unrelated information. ConceptDraw MINDMAP software is effective to save your time and efforts when carrying out a SWOT Analysis. The SWOT and TOWS Matrix Diagrams solution, that is available from ConceptDraw Solution Park, contains easy-to-use Mind Map templates to help you identify the Strengths, Weaknesses, Opportunities, and Threats, and represent the SWOT analysis results on the professionally-looking Mind Map.Value Stream Diagram
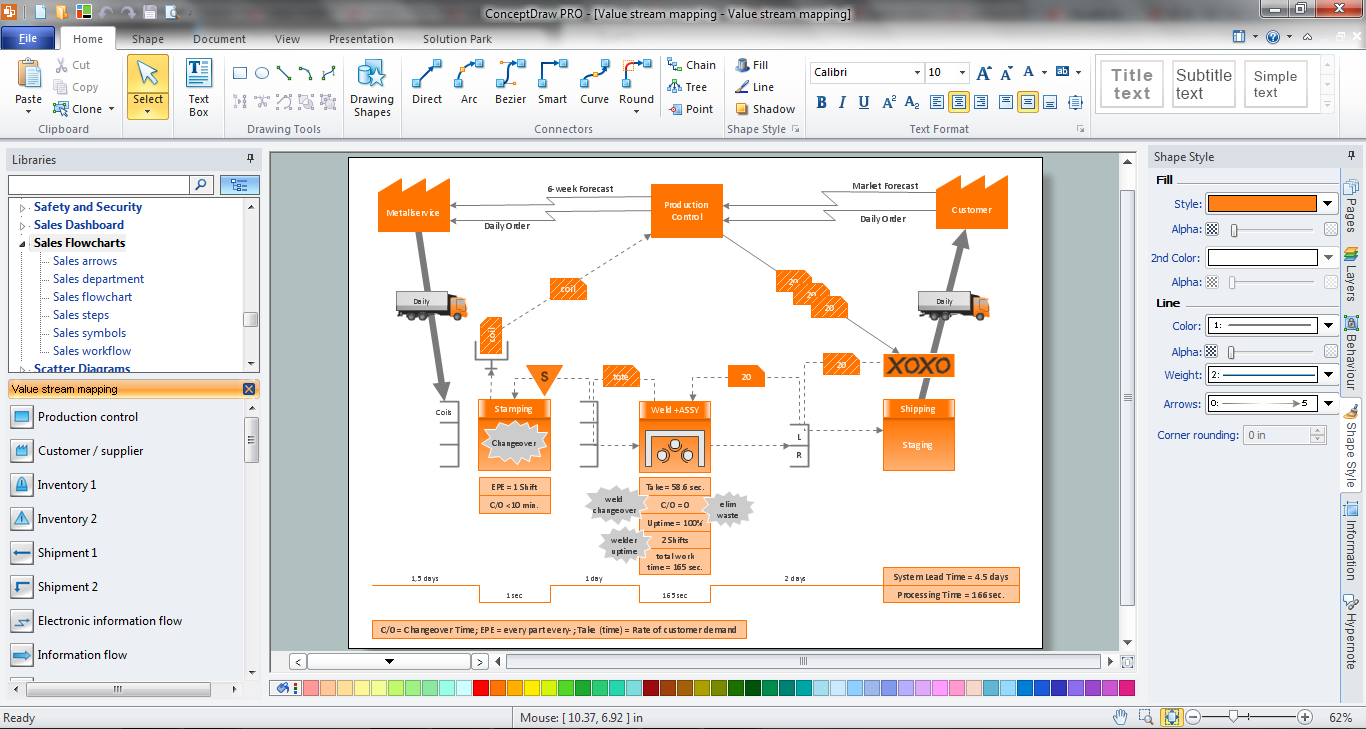
The new Value Stream Mapping solution found in the ConceptDraw Solution Park continues to extend the range of ConceptDraw PRO into a business graphics tool.Create a Value Stream Map Rapidly
The Value Stream Mapping solution from ConceptDraw Solution Park extends ConceptDraw PRO software with a new library that contains vector objects, samples and templates.Basic Flowchart Examples
ConceptDraw PRO is a business flowchart software includes the wide flowchart examples package.Total Quality Management Value
The Total quality management (TQM) is an enterprise-wide method of continuous quality improvement of all organizational processes, including the enhancement of ability to deliver high-quality products and services to the customers. The TQM includes eight main elements, which have great value: customer-focused, process-centered, total employee involvement, integrated system, continual improvement, strategic and systematic approach, fact-based decision making, communications. ConceptDraw PRO diagramming and vector drawing software offers the Total Quality Management Diagram solution with effective drawing tools, predesigned vector elements, samples and templates that help easy design the Total Quality Management diagrams, TQM flowcharts and Mind Maps widely used in quality management projects to visualize the business processes and industrial processes for your organization, to demonstrate the quality control step-by-step in a visual manner, to compare visually the ideal and real stages of processes.Value Stream Mapping
Use ConceptDraw Value Stream Maps (VSM) visualization for a manufacturing plant the material and information flow required to deliver a product/service to customers. The new Value Stream Mapping solution found in the ConceptDraw Solution Park continues to extend the range of ConceptDraw PRO into a business graphics tool that can be used to document processes in any organization.- Swim Lane Diagrams | Swim Lane Flowchart Symbols | Cross ...
- Process Flowchart | How Do You Make An Accounting Process ...
- Payroll process - Swim lane process mapping diagram | Value ...
- Garments Management System Dfd
- Process Flowchart | 4 Ms fishbone diagram - Production process ...
- Data Flow Diagram Model | How Do Fishbone Diagrams Solve ...
- Value Stream Mapping Examples Produc
- Cash Payment Process Flow Chart
- Value Stream Analysis | What is Value Stream Mapping ? | Value ...
- Value stream with ConceptDraw PRO | Value Stream & Process ...


