Flowchart Marketing Process. Flowchart Examples
This sample shows the Flowchart that displays the layout and work flow of the cloud marketing platform. This diagram has a style of the marketing brochure. This style displays the central product that is related to the other issues. Using the ready-to-use predesigned objects, samples and templates from the Flowcharts Solution for ConceptDraw DIAGRAM you can create your own professional looking Flowchart Diagrams quick and easy.
 Healthcare Management Workflow Diagrams
Healthcare Management Workflow Diagrams solution contains large set of colorful samples and libraries with predesigned vector pictograms and symbols of health, healthcare equipment, medical instruments, pharmaceutical tools, transport, medication, departments of healthcare organizations, the medical icons of people and human anatomy, as well as the predesigned flowchart objects, connectors and arrows, which make it the best for designing clear and comprehensive Medi?al Workflow Diagrams and Block Diagrams, Healthcare Management Flowcharts and Infographics, Healthcare Workflow Diagram, for depicting the healthcare workflow and clinical workflows in healthcare, for making the workflow analysis healthcare and healthcare workflow management.
Fishbone Diagram Example
Fishbone Diagram, also referred as Cause and Effect diagram or Ishikawa diagram, is a fault finding and problem solving tool. Construction of Ishikawa diagrams is quite complicated process and has a number of features. Fishbone Diagrams solution included to ConceptDraw Solution Park contains powerful drawing tools and a lot of examples, samples and templates. Each Fishbone diagram example is carefully thought-out by experts and is perfect source of inspiration for you.Organizational Structure
The organizational structure reflects the composition and hierarchy of company's divisions, determines the distribution of authorities and responsibilities within the organization, and facilitates the understanding by workers their responsibilities. It also defines the group of people making key decisions at the company. Visualization of organizational structure of any company, organization or institution is not an easy task, because sometimes the company may include several departments, each with more than thousand persons. For such large organizations often are created the Organizational charts for every department separately. There are many ways of organization's structuring, which determine its work. Often happens that organizational structure adapts to production process. ConceptDraw DIAGRAM extended with unique Organizational Charts solution from Management area of ConceptDraw Solution Park is a powerful organizational structure software, which ideally suits for developing Organizational Charts of any type and any complexity.Fire Exit Plan. Building Plan Examples
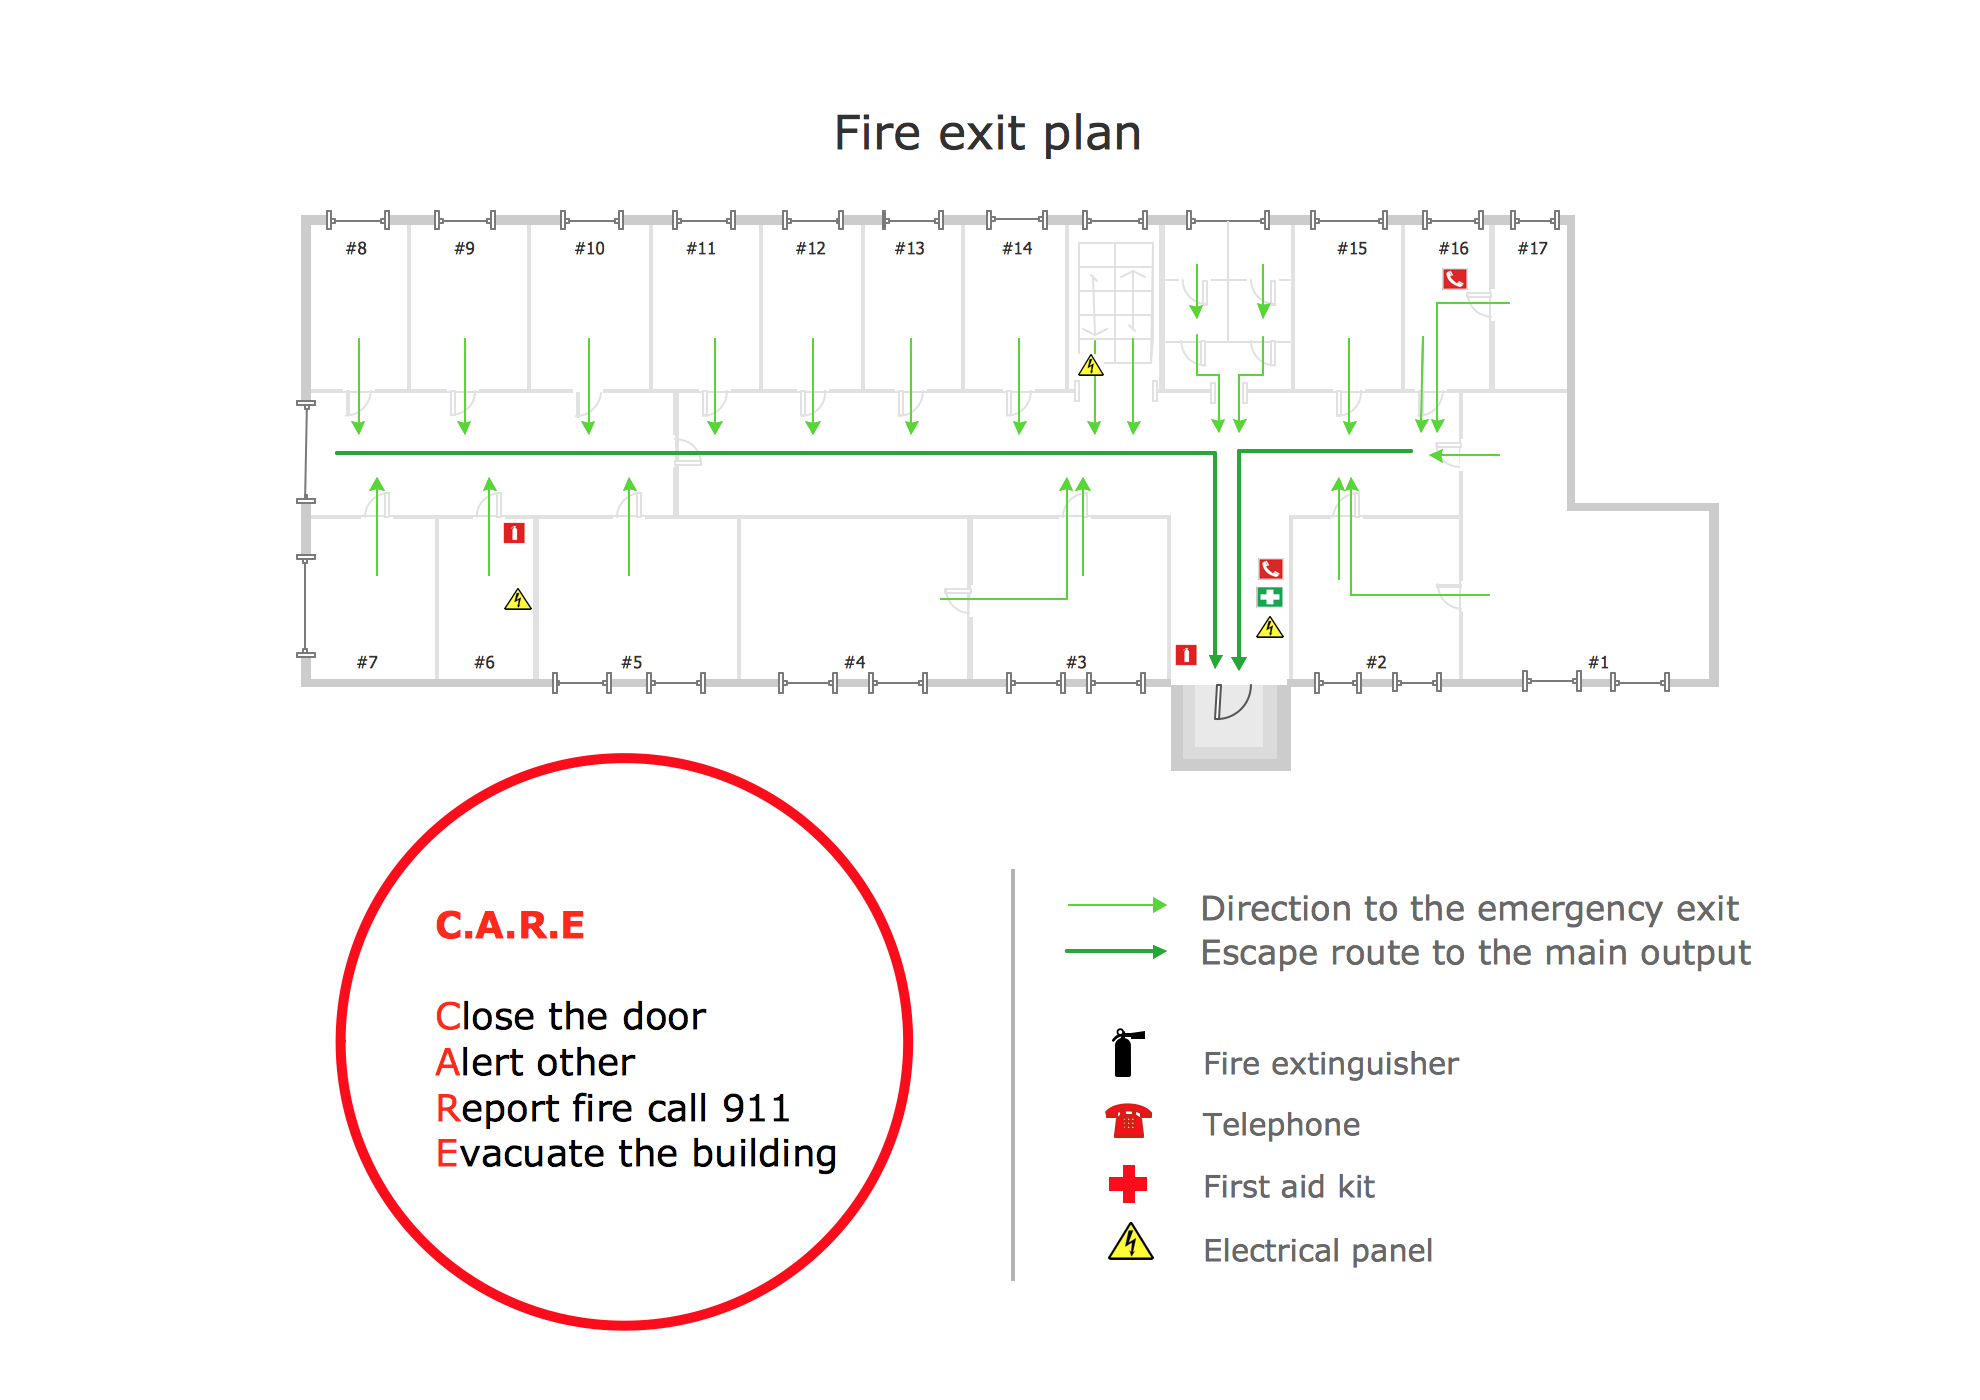
Fire exit plan or Emergency exit plan is an obligatory scheme for schools, universities, hospitals, hotels, business centers, metro, airports, and a lot of other buildings, public and private institutions. Fire exit plan depicts detailed plan of the building with marked emergency exits on it and helps to implement faster evacuation in various emergencies such as a fire. If a regular exit is blocked by fire, the plan helps to find the alternative exits, on the route to which are placed the signs leading to it. Fire and Emergency Plans solution from the Building Plans area of ConceptDraw Solution Park provides examples and samples, Fire and Emergency Plan quick-start template and vector stencils library with fire-fighting equipment design elements for drawing different types of emergency and fire schemes and plans: Evacuation plans, Fire Exit plans, Home Emergency plans, School Emergency plans, Office Emergency plans, Fire Emergency plans, Fire Evacuation plans, Fire Safety diagrams, Business Emergency plans, etc.Data Flow Diagram
Data Flow Diagram (DFD) is the part of the Structured Systems Analysis and Design Methodology (SSADM), which is intended for information systems projection and analysis. Data Flow Diagrams allow graphically represent the data flows in information system and analyze the data processing during the structural projection. This type of diagrams lets visually show a work of information system and results of this work, it is often used in connection with human processes and can be displayed as Workflow diagram. Data Flow Diagram visualizes processes and functions, external entities, data depositories, and data flows connecting these elements and indicating direction and data character. Each of these elements used for DFD has its own graphical notation. There are two notations to draw DFDs - Yourdon & Coad and Gane & Sarson. ConceptDraw DIAGRAM extended with Data Flow Diagrams (DFD) solution from Software Developmant area is ideal for designing professional looking DFDs, which can be then easily exported in various formats.Mind Maps for Business - SWOT Analysis
SWOT analysis is a planning method and the best way for effective exploring four major aspects for a business or a venture - strengths, weaknesses, opportunities and threats. Visually SWOT analysis results are depicted as a SWOT matrix, diagram or Mind Map, which is then included to the set of documents, report or in presentation devoted to demonstration the results of realized SWOT analysis for directors, shareholders, and other interested employees. ConceptDraw Solution Park includes the SWOT and TOWS Matrix Diagrams solution, which offers wide possibilities for realization SWOT analysis and creation SWOT Matrices and SWOT Mind Maps in ConceptDraw DIAGRAM and ConceptDraw MINDMAP software. This solution includes fully ready-to-use SWOT vector design elements, SWOT matrix samples and also useful templates that allow users create own SWOT diagrams and Mind Maps for business SWOT analysis in a few minutes. Use also the perfect ability of instantly exporting to various formats and of creation MS PowerPoint presentation right from the ConceptDraw applications.How to Draw an Organization Chart
An Organizational chart is a type of diagram which visually displays the structure of an organization, relationships and relative ranks of the organization′s parts and positions. Organizational chart is constructed as an hierarchical structure, in the form of tree. How to Draw an Organization Chart the most easy and quickly? The Organizational Charts solution, innovative Tree Auto-connection mode and ConceptDraw Arrows10 Technology included in ConceptDraw DIAGRAM software are powerful drawing tools that change the way of diagrams production. Arrows10 Technology provides smart behavior for the connectors, and so quick and precise placement when drawing, and lets easy make the changes and automatic rearrangement. It helps to make the process of drawing diagrams more efficient, easier and faster. Now, you don′t need to think on how to connect or place the objects, you can concentrate fully on what to draw. See obligatory the helpful video tutorial about creation the Organization Charts and orgchart professional presentations with ConceptDraw products.Diagramming Software for Design UML Timing Diagrams
UML Timing Diagram as special form of a sequence diagram are used to explore the behaviors of objects throughout a given period of time.
UML Business Process
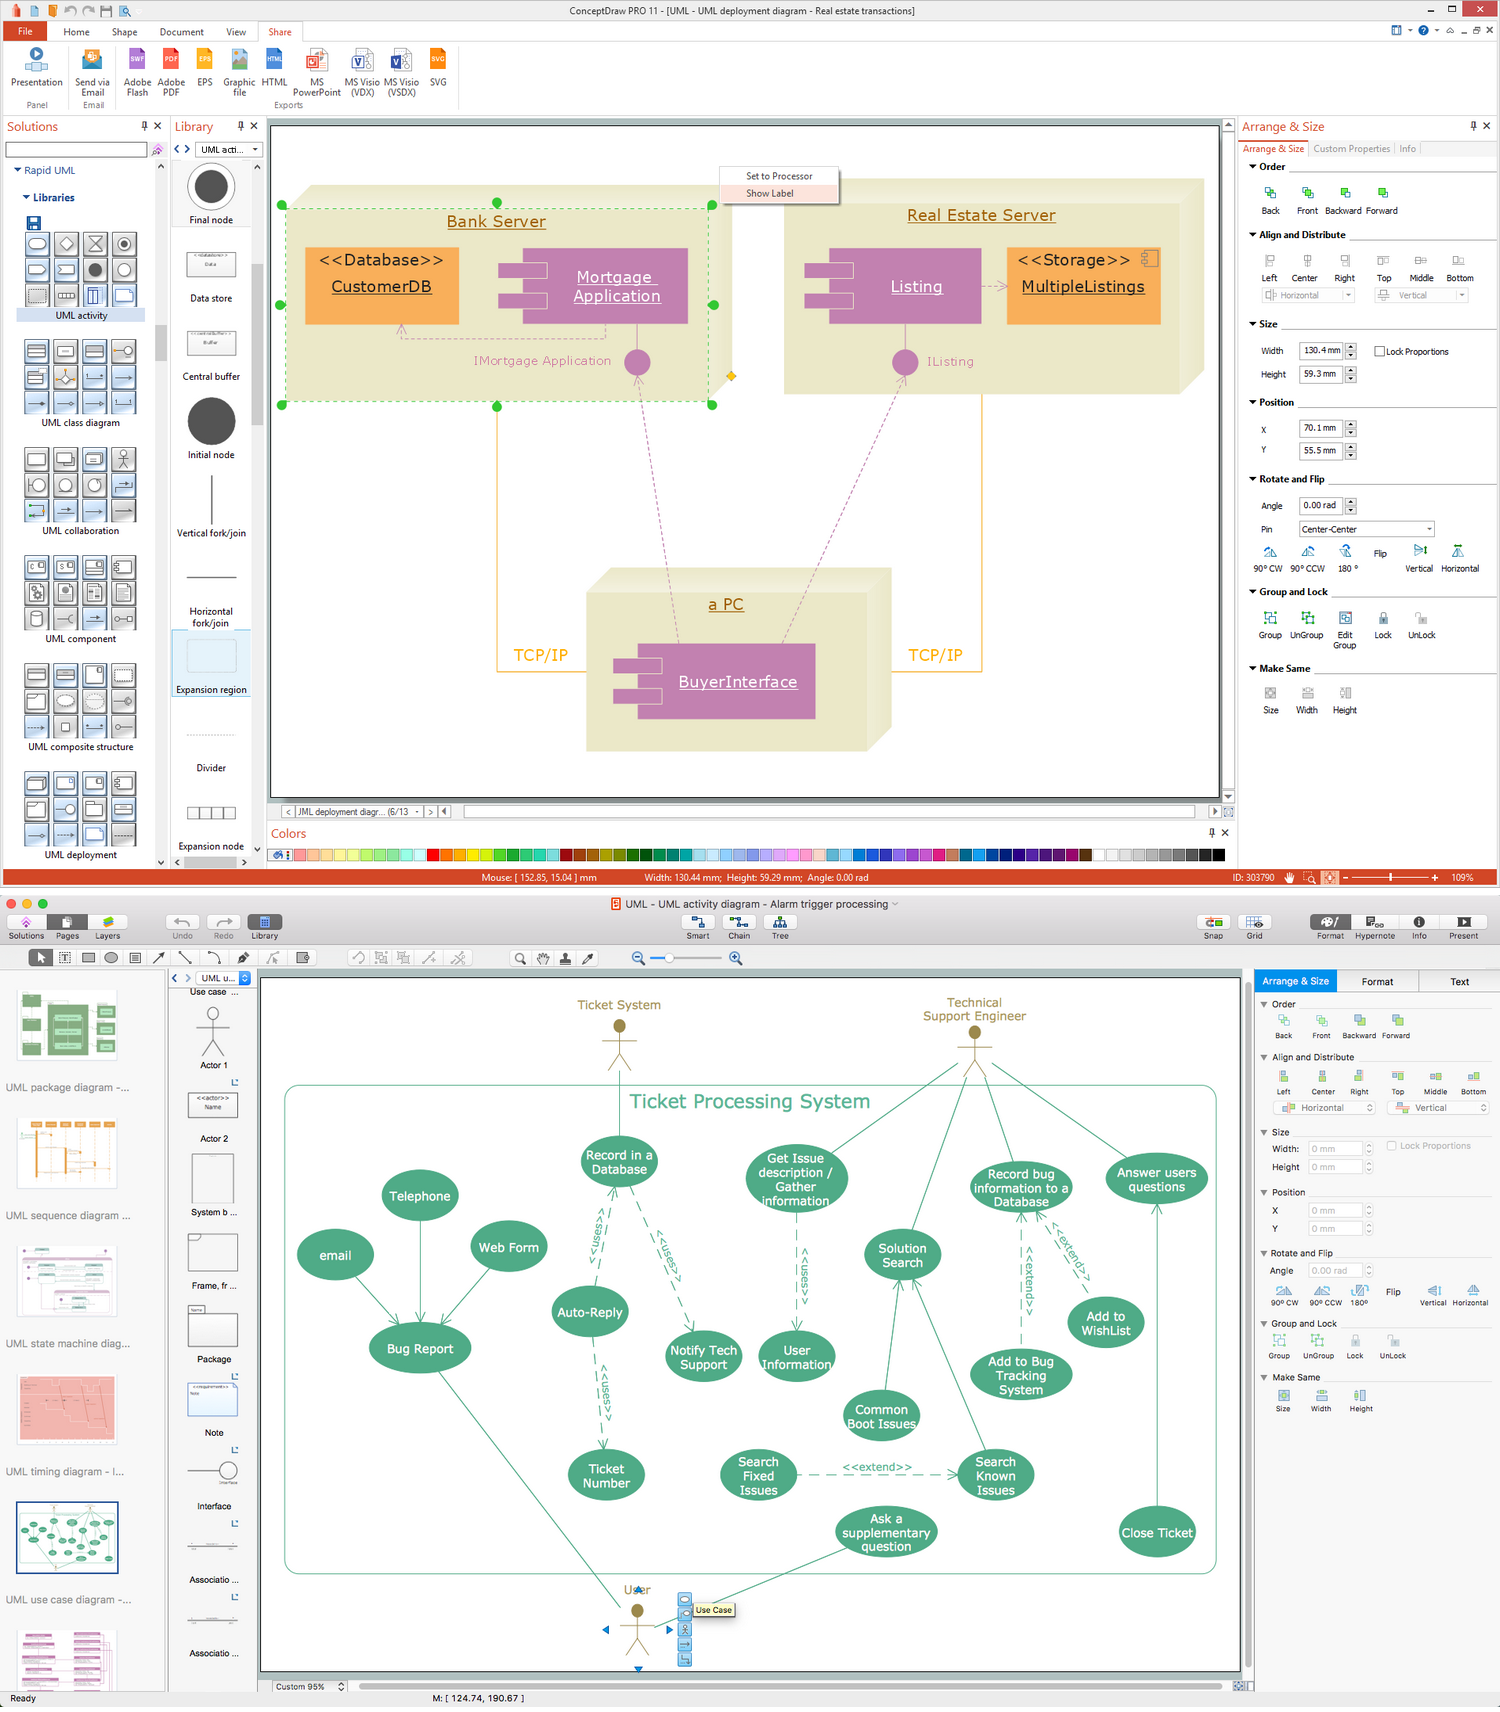
UML diagrams of business processes. The Rapid UML solution provides diagram examples, templates and vector stencils libraries for quick and easy drawing all types of UML 2.x and 1.x diagrams: UML activity diagrams, UML communication (collaboration) diagrams, UML component diagrams, UML composite structure diagrams, UML deployment diagrams, UML interaction overview diagrams, UML object diagrams, UML package diagrams, UML sequence diagrams, UML state machine diagrams, UML timing diagrams, UML use case diagrams.- Data And Process Flow Chart Of Hospital Accounting Operations ...
- Process Flow Chart Of Hospital Service
- Basic Flowchart Symbols and Meaning | Audit Flowchart Symbols ...
- ConceptDraw Solution Park | Line Graphs | Cross-Functional ...
- Cross-Functional Flowchart | Cross-Functional Process Map ...
- Process Map Fo Qa
- Business Process Mapping — How to Map a Work Process | How to ...
- Enterprise Architecture Diagrams | IDEF Business Process ...
- Design elements - Subway map , Map symbols | Chemical and ...


