HelpDesk
How to Use ConceptDraw Sales Dashboard Solution
The interactive visual dashboard is a valuable tool for any sales team. Sales dashboard allows you to view and monitor sales indicators that are important for manager and sales staff . It helps to use the timely and reliable information to improve the quality of sales performance and increase sales revenues. ConceptDraw Sales Dashboard solution is a tool for both: sales manager and sales team. It provides the visualization of key performance indicators that are critical to the entire sales organization. The custom sales dashboard displays the real-time information on sales performance KPIs with the help of intuitive and easy-to-understand diagrams and charts. Sales Dashboard helps the entire team see where they are, and what needs to be done. With ConceptDraw PRO you can easily create a visual Sales Dashboard using Live Objects Technology.
HelpDesk
How to Draw a Scatter Diagram Using ConceptDraw PRO
Scatter Diagrams are used to visualize how a change in one variable affects another. A Scatter Diagram displays the data as a set of points in a coordinate system. It combines these values into single data points and displays them in uneven intervals. A Scatter Diagram can be very useful to for identifying relationships between variables, for example the relationship of price and quality rating. Making a Scatter Diagram involves many different elements that can be managed using ConceptDraw Scatter Diagram solution.HelpDesk
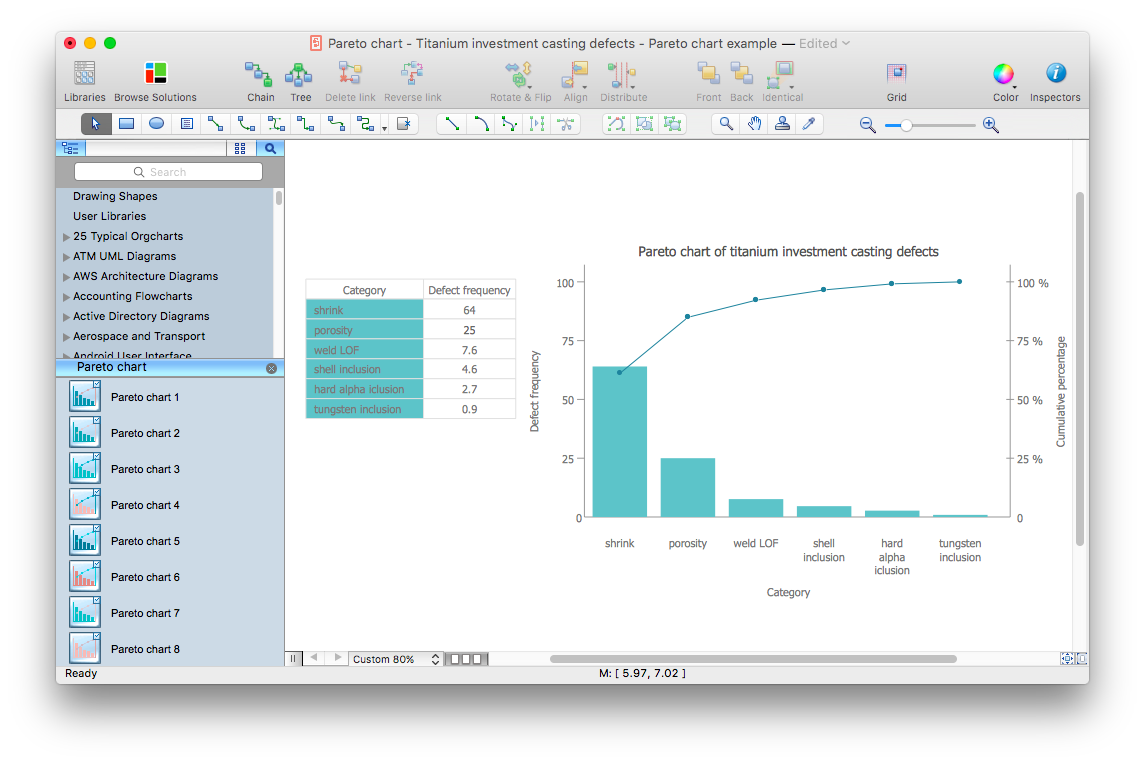
How to Draw a Pareto Chart Using ConceptDraw PRO
The Seven Basic Tools of Quality were picked as effective visual tool-set for identifying the root cause of quality-related problems within the workplace. Seven Basic Tools of Quality comprise of seven diagram that are diverse enough to be used to any business troubleshooting scenario, but simple enough that employees of all types can understand and apply them. One of these tools is a Pareto chart. It combines both a line graph and a bar chart, where the bar chart displays data values, and a line represents a total value. Pareto chart is used for quality control to identify the source of the quality problem. ConceptDraw Seven Basic Tools of Quality solution delivers a big set of vector stencil libraries and samples for each quality control diagram, including a Pareto chart.HelpDesk
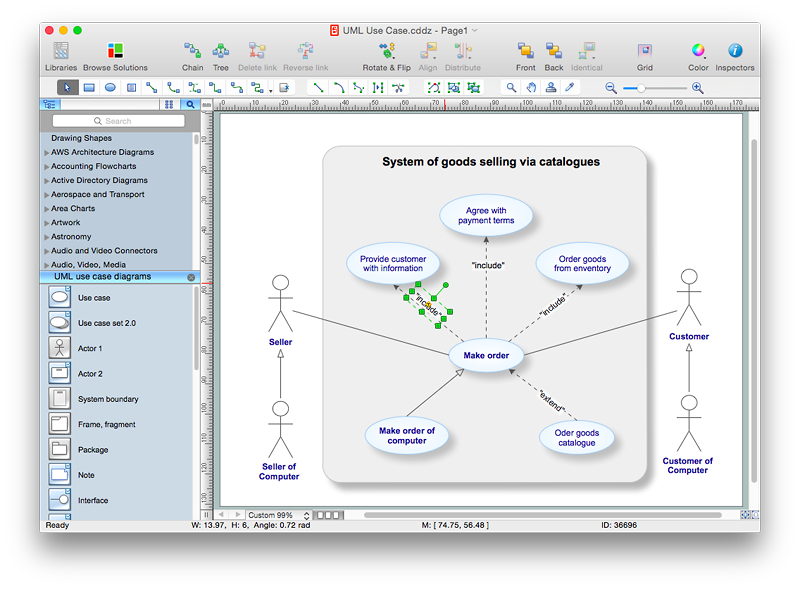
How to Add Text to a Connector in ConceptDraw PRO
The new ConceptDraw Arrows10 Technology is a powerful diagramming technique that powered the way business drawing created. ConceptDraw PRO gives you some tools for connecting shapes: Direct Connectors, Smart, Arc, Bezier, Curve and Round Connectors.Direct Connectors are direct lines from the point to the point. Smart , Arc, Bezier, Curve and Round Connectors are almost the same as Direct Connectors. However, they automatically move around other objects. You can use Chain, or Tree connection mode for connection of multiple objects with any type of connectors. ConceptDraw PRO allows you to add and move text on a connector the same way that you add and move text on other any object.- Draw A Table That Showing Flowchart Symbol Block And Their
- Chem Draw A Modern Periodic Table Of Elements
- Draw A Table For Time Management
- Process Flowchart | Flow Chart Symbols | Draw Achart Of Priodic ...
- Process Flowchart | Seating Plans | Basic Flowchart Symbols and ...
- Chemical and Process Engineering | How to Draw a Chemical ...
- Draw A Flow Chart Diagram Table
- How To Share Presentation via Skype | How To Draw A Periodic Table
- Symbol for Pool Table for Floor Plans | Building Drawing Software ...
- Draw A Clearly And Complete Periodic Table
- Process Flowchart | How to Draw a Chemical Process Flow Diagram ...
- Chemistry Drawings | Chemistry Drawing Software | Chemistry ...
- Software and Database Design with ConceptDraw PRO | Process ...
- Chemistry | Flow Chart Of Periodic Table
- How to Draw Chemistry Structures | Chemistry | Chemistry Drawing ...
- Winter Sports. Olympic Games Infographics. Medal Table | Basic ...
- Design elements - Periodic table of chemical elements | Design ...
- Electrical Engineering | Symbol for Pool Table for Floor Plans | How ...
- How to Draw Chemistry Structures | Process Flowchart | How to ...
- Mechanical Drawing Software | Process Engineering | Process ...


