 Event-driven Process Chain Diagrams
Event-Driven Process Chain Diagrams solution extends ConceptDraw DIAGRAM functionality with event driven process chain templates, samples of EPC engineering and modeling the business processes, and a vector shape library for drawing the EPC diagrams and EPC flowcharts of any complexity. It is one of EPC IT solutions that assist the marketing experts, business specialists, engineers, educators and researchers in resources planning and improving the business processes using the EPC flowchart or EPC diagram. Use the EPC solutions tools to construct the chain of events and functions, to illustrate the structure of a business process control flow, to describe people and tasks for execution the business processes, to identify the inefficient businesses processes and measures required to make them efficient.
Business diagrams & Org Charts with ConceptDraw DIAGRAM
The business diagrams are in great demand, they describe the business processes, business tasks and activities which are executed to achieve specific organizational and business goals, increase productivity, reduce costs and errors. They let research and better understand the business processes. ConceptDraw DIAGRAM is a powerful professional cross-platform business graphics and business flowcharting tool which contains hundreds of built-in collections of task-specific vector stencils and templates. They will help you to visualize and structure information, create various Business flowcharts, maps and diagrams with minimal efforts, and add them to your documents and presentations to make them successful. Among them are Data flow diagrams, Organization charts, Business process workflow diagrams, Audit flowcharts, Cause and Effect diagrams, IDEF business process diagrams, Cross-functional flowcharts, PERT charts, Timeline diagrams, Calendars, Marketing diagrams, Pyramids, Target diagrams, Venn diagrams, Comparison charts, Analysis charts, Dashboards, and many more. Being a cross-platform application, ConceptDraw DIAGRAM is very secure, handy, free of bloatware and one of the best alternatives to Visio for Mac users.
 Business Process Diagrams
Business Process Diagrams solution extends the ConceptDraw DIAGRAM BPM software with RapidDraw interface, templates, samples and numerous libraries based on the BPMN 1.2 and BPMN 2.0 standards, which give you the possibility to visualize equally easy simple and complex processes, to design business models, to quickly develop and document in details any business processes on the stages of project’s planning and implementation.
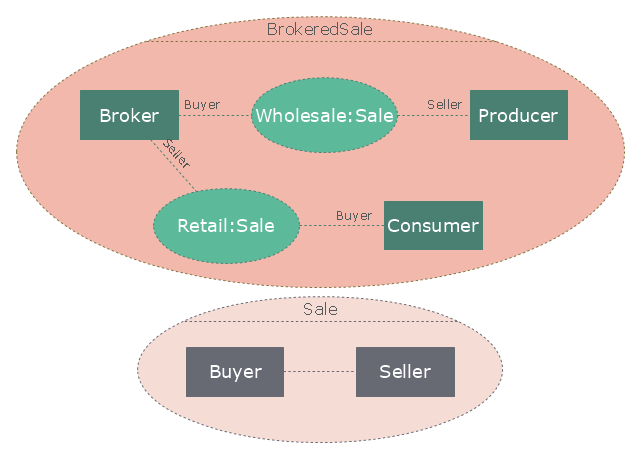
"A broker is an individual or party (brokerage firm) that arranges transactions between a buyer and a seller for a commission when the deal is executed. A broker who also acts as a seller or as a buyer becomes a principal party to the deal. Distinguish agent - one who acts on behalf of a principal. ...
In general a broker is an independent agent used extensively in some industries. A broker's prime responsibility is to bring sellers and buyers together and thus a broker is the third-person facilitator between a buyer and a seller. An example would be a real estate broker who facilitates the sale of a property.
Brokers also can furnish market information regarding prices, products, and market conditions. Brokers may represent either the seller (90% of the time) or the buyer (10%) but not both at the same time. An example would be a stockbroker, who makes the sale or purchase of securities on behalf of his client. Brokers play a huge role in the sale of stocks, bonds, and other financial services." [Broker. Wikipedia]
The UML composite structure diagram example "Sale process" was created using the ConceptDraw PRO diagramming and vector drawing software extended with the Rapid UML solution from the Software Development area of ConceptDraw Solution Park.
- Sales Order Entry Process Flow Chart
- Flowchart For Sales Order Process
- Process Flowchart | Basic Flowchart Symbols and Meaning | Cross ...
- Invoice payment process - Flowchart | Purchase order processing ...
- Credit Card Order Process Flowchart. Flowchart Examples | Sales ...
- UML Use Case Diagram Example - Estate Agency | Work Order ...
- Flow Chart Of Sales Order Processing
- Sales Order Process Diagram
- Sales Process Flowchart. Flowchart Examples | Block diagram ...
- Sales Order Processing Flow Chart With Details
- Sales Process Flowchart. Flowchart Examples | Work Order Process ...
- Credit Card Order Process Flowchart. Flowchart Examples | Event ...
- Sales Process Flowchart. Flowchart Examples | Sales Process ...
- Taxi service order procedure - BPMN 1.2 diagram | Business ...
- Sale And Purchase Order Processing Diagram
- Process Flowchart | Basic Flowchart Symbols and Meaning | Cross ...
- Sales Order Process Flow Chart
- Sales Order Workflow Diagram
- Credit Card Processing System UML Diagram | Credit Card Order ...
- Organizational Structure | Sales Process Flowchart Symbols | Work ...

