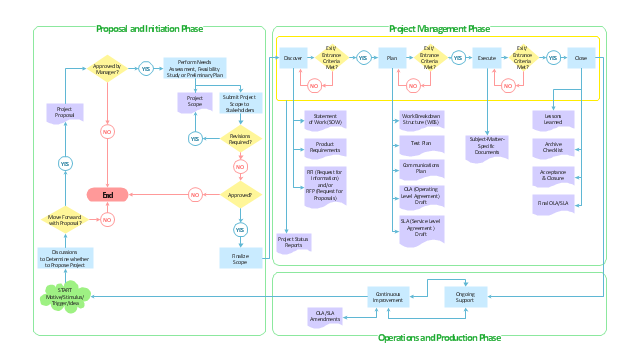
"Product life cycle is a business analysis that attempts to identify a set of common stages in the life of commercial products. In other words the 'Product Life cycle' PLC is used to map the lifespan of the product such as the stages through which a product goes during its lifespan. ...
The stages of a product's life cycle... :
1. INTRODUCTION... 2. GROWTH... 3. MATURITY... 4. DECLINE...
The product life cycle is an important concept in marketing. It includes four stages that a product goes through from when it was first thought of until it is eliminated from the industry. Not all products reach this final stage. Some continue to grow and others rise and fall." [Product lifecycle. Wikipedia]
The flow chart example "Product life cycle process" was created using the ConceptDraw PRO diagramming and vector drawing software extended with the Flowcharts solution from the area "What is a Diagram" of ConceptDraw Solution Park.
Diversification is a corporate strategy to increase sales volume from new products and new markets. Diversification can be expanding into a new segment of an industry that the business is already in, or investing in a promising business outside of the scope of the existing business.
Diversification is part of the four main growth strategies defined by Igor Ansoff's Product/ Market matrix.
Ansoff pointed out that a diversification strategy stands apart from the other three strategies. The first three strategies are usually pursued with the same technical, financial, and merchandising resources used for the original product line, whereas diversification usually requires a company to acquire new skills, new techniques and new facilities. [Diversification (marketing strategy). Wikipedia]
This Ansoff's Product/ Market matrix example was created using ConceptDraw PRO diagramming and vector drawing software extended with Matrices solution from Marketing area of ConceptDraw Solution Park.
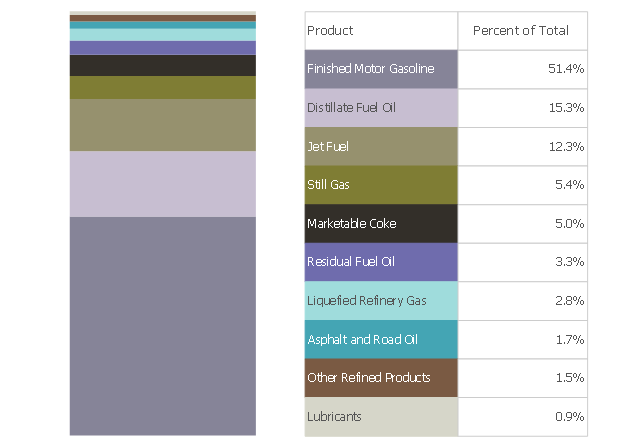
This divided bar chart sample shows the petroleum products yielded from 1 barrel of crude oil in California in 2004. It was drawn using data from the chart on the California Energy Almanac website. [energyalmanac.ca.gov/ gasoline/ whats_ in_ barrel_ oil.html]
"Petroleum products are useful materials derived from crude oil (petroleum) as it is processed in oil refineries. Unlike petrochemicals, which are a collection of well-defined usually pure chemical compounds, petroleum products are complex mixtures. The majority of petroleum is converted to petroleum products, which includes several classes of fuels.
According to the composition of the crude oil and depending on the demands of the market, refineries can produce different shares of petroleum products. The largest share of oil products is used as "energy carriers", i.e. various grades of fuel oil and gasoline. These fuels include or can be blended to give gasoline, jet fuel, diesel fuel, heating oil, and heavier fuel oils. Heavier (less volatile) fractions can also be used to produce asphalt, tar, paraffin wax, lubricating and other heavy oils. Refineries also produce other chemicals, some of which are used in chemical processes to produce plastics and other useful materials. Since petroleum often contains a few percent sulfur-containing molecules, elemental sulfur is also often produced as a petroleum product. Carbon, in the form of petroleum coke, and hydrogen may also be produced as petroleum products. The hydrogen produced is often used as an intermediate product for other oil refinery processes such as hydrocracking and hydrodesulfurization." [Petroleum product. Wikipedia]
The chart example "Petroleum products yielded from one barrel of crude oil" was created using the ConceptDraw PRO diagramming and vector drawing software extended with the Divided Bar Diagrams solution from the Graphs and Charts area of ConceptDraw Solution Park.
Product Overview
ConceptDraw PROJECT is a vigorous tool for managing single or multiple projects. It lets you determine all essential elements involved into project, control schedules, resources and finances, and monitor projects' progress in most effective yet simple manner.Product Overview
ConceptDraw PRO offers a wide choice of powerful and easy-to-use tools for quickly creating all kinds of charts and diagrams. Even if you've never used a drawing tool before, it's very easy to create high-quality professional graphic documents with ConceptDraw PRO.HelpDesk
How to Use ConceptDraw Single User License
With ConceptDraw products it is possible to reassign a licensesHelpDesk
How to Remove ConceptDraw Products from Mac and PC
CS Odessa provides registered users a 21 day trial period at no charge. A Trial License can be used to run a fully functional version of ConceptDraw products for 21 days. Trial mode functions exactly as a fully licensed copy of the product does. After your trial has expired and you have not yet purchased a license, the product reverts to Demo mode. The following article contains the instruction for those trial users who want to remove ConceptDraw products after the trial period is over.- Conceptdraw.com: Mind Map Software, Drawing Tools | Project ...
- Matrices | Ansoff's product / market matrix | What is SWOT Analysis ...
- Product Comparison Matrix Template
- Ansoff product -market growth matrix - Template | Ansoff product ...
- Ansoff's product / market matrix | SWOT Analysis Solution - Strategy ...
- Ansoff's product / market matrix
- Fishbone Diagram Poor Quality Of Product
- Product life cycle process - Flowchart | Draw Flowcharts with ...
- Diagram Of Product Mix
- Flow Chart For Development And Release Of New Product
- Flowchart of Products . Flowchart Examples | Product life cycle ...
- Product Proposal Template | Product Proposal Documents ...
- Product life cycle process - Flowchart
- Product life cycle process - Flowchart | Process Flowchart | Sales ...
- Draw Or Design A Picture That Represents A Product Of Each ...
- Product life cycle process - Flowchart | Project management life ...
- Matrix Design For Product Comparison Sample
- How to Make an Ansoff Matrix Template in ConceptDraw PRO
- Concept Of Product Market With Diagram
- Service Product Continuum Example


