This cause and effect diagram sample was redesigned from the Wikimedia Commons file: Ursache Wirkung Diagramm Beispiel.png. [commons.wikimedia.org/ wiki/ File:Ursache_ Wirkung_ Diagramm_ Beispiel.png]
This file is licensed under the Creative Commons Attribution-Share Alike 3.0 Unported license. [creativecommons.org/ licenses/ by-sa/ 3.0/ deed.en]
"Productivity is the ratio of output to inputs in production; it is an average measure of the efficiency of production. Efficiency of production means production’s capability to create incomes which is measured by the formula real output value minus real input value.
Productivity is a crucial factor in production performance of firms and nations. Increasing national productivity can raise living standards because more real income improves people's ability to purchase goods and services, enjoy leisure, improve housing and education and contribute to social and environmental programs. Productivity growth also helps businesses to be more profitable." [Productivity. Wikipedia]
The fishbone diagram example "Increase in productivity" was created using the ConceptDraw PRO diagramming and vector drawing software extended with the Fishbone Diagrams solution from the Management area of ConceptDraw Solution Park.
Ishikawa diagram

Export from ConceptDraw DIAGRAM Document to a Graphic File


Cause and Effect Diagram

 Fishbone Diagrams
The Fishbone Diagrams solution extends ConceptDraw DIAGRAM software with the ability to easily draw the Fishbone Diagrams (Ishikawa Diagrams) to clearly see the cause and effect analysis and also problem solving. The vector graphic diagrams produced using this solution can be used in whitepapers, presentations, datasheets, posters, and published technical material.
Cause and Effect Fishbone Diagram

Powerful Drawing Feature for Creating Professional Diagrams

Think. Act. Accomplish.

 Business Processes Area
Solutions of Business Processes area extend ConceptDraw DIAGRAM software with samples, templates and vector stencils libraries for drawing business process diagrams and flowcharts for business process management.
Metropolitan area networks (MAN). Computer and Network Examples
. Computer and Network Examples")

Personal area (PAN) networks. Computer and Network Examples
 networks")
How To Create Project Report

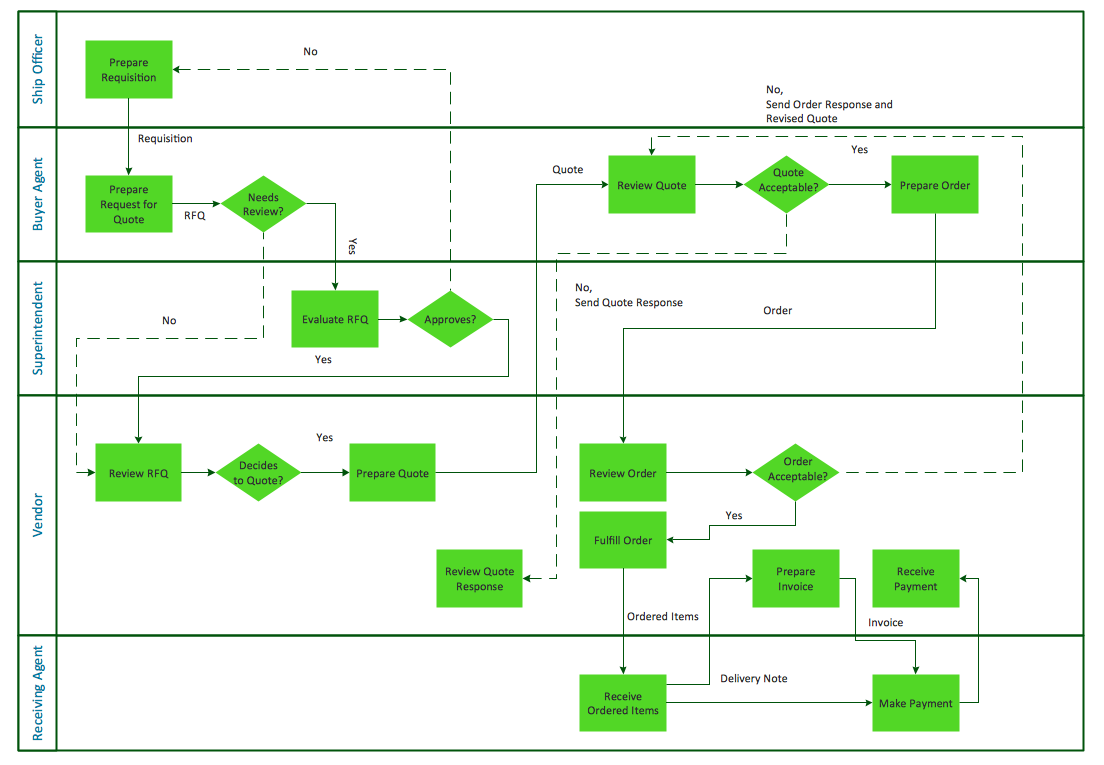
Horizontal Cross Functional Flowchart
- Cause and effect diagram - Increase in productivity | Bar Diagrams ...
- Cause and effect diagram - Increase in productivity | Porter five ...
- Total Quality Management Value | Cause and effect diagram ...
- Business Productivity - Marketing | Cause and effect diagram ...
- Cause and effect diagram - Increase in productivity | Total Quality ...
- Cause and effect diagram - Increase in productivity | Process ...
- Business Productivity - Marketing | HR symbols - Vector stencils ...
- Cause and effect diagram - Increase in productivity | Process ...
- Cause and effect diagram - Increase in productivity | HR symbols ...
- Cause and effect diagram - Increase in productivity | Business ...
- Productivity Cause And Effect Diagram
- Fishbone Diagram Template | Process Flowchart | Entity ...
- Cause To Effect Model In Production
- Cause and effect diagram - Increase in productivity
- Data Flow Diagram Model | Peru wheat area and production | 4 Ms ...
- Cause and effect diagram - Increase in productivity | Fishbone ...
- Cause and effect diagram - Increase in productivity | Home area ...
- Cause and effect diagram - Increase in productivity | Drawing ...
- Effects of taxes and benefits | Cause and effect diagram - Increase in ...
- Fishbone diagram - Bad coffee | Cause and effect diagram ...