 Computer and Networks Area
The solutions from Computer and Networks Area of ConceptDraw Solution Park collect samples, templates and vector stencils libraries for drawing computer and network diagrams, schemes and technical drawings.
HelpDesk
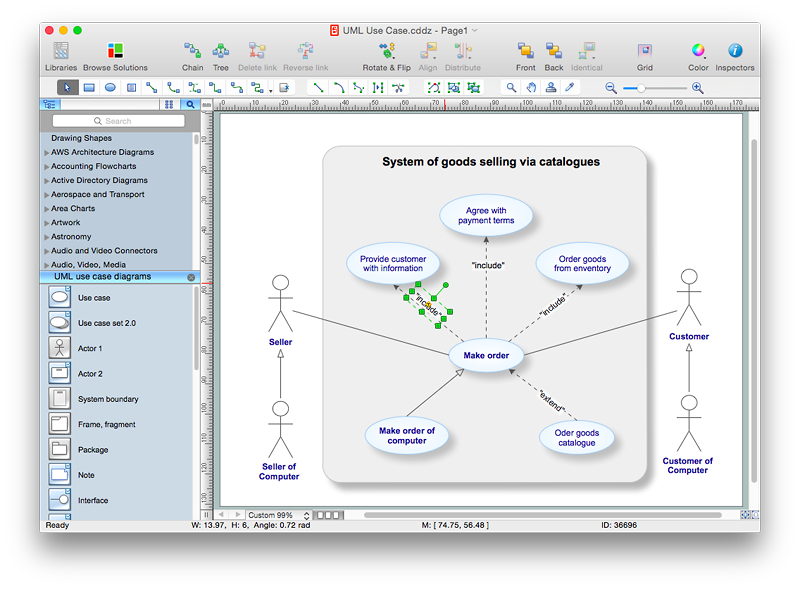
How to Add Text to a Connector in ConceptDraw PRO
The new ConceptDraw Arrows10 Technology is a powerful diagramming technique that powered the way business drawing created. ConceptDraw PRO gives you some tools for connecting shapes: Direct Connectors, Smart, Arc, Bezier, Curve and Round Connectors.Direct Connectors are direct lines from the point to the point. Smart , Arc, Bezier, Curve and Round Connectors are almost the same as Direct Connectors. However, they automatically move around other objects. You can use Chain, or Tree connection mode for connection of multiple objects with any type of connectors. ConceptDraw PRO allows you to add and move text on a connector the same way that you add and move text on other any object.ConceptDraw Arrows10 Technology
How should diagramming software work? Is it possible to develop a diagram as quickly as the ideas come to you? The innovative ConceptDraw Smart Connectors Technology - This is more than enough versatility to draw any type of diagram with any degree of complexity. Connection points are necessary for diagramming network, flowchart and organizational charts. In ConceptDraw you connect shapes by attaching, or snapping and gluing, connectors to shape connection points.HelpDesk
How to Create a Bar Chart in ConceptDraw PRO
Bar charts (bar graphs) are diagrams displaying data as horizontal or vertical bars of certain heights. Bar charts are widely used to show and compare the values of the same parameters for different data groups. The bar graph can be vertical or horizontal. This depends on the amount of categories. There are many methods in which bar graph can be built and this makes it a very often used chart type. Usually, a bar chart is created so that the bars are placed vertically. Such arrangement means that the bar's height value is proportional to the category value. Nevertheless, a bar chart can be also drawn horizontally. This means that the longer the bar, the bigger the category. Thus, a bar chart is a good way to present the relative values of different measured items. The ConceptDraw Bar Graphs solution allows you to draw a bar chart quickly using a vector library, containing the set of various bar charts objects.- Draw And Label A Product Life Cycle Diagram
- Draw And Label The Diagram Of Crude Oil
- Process Flowchart | Block diagram - Branding strategies | Draw ...
- Label Diagram Of Life Cycle
- Area Chart Of Management And Draw And Label
- Block diagram - Branding strategies | Bar Diagrams for Problem ...
- Well Label Diagram Of Crude Distillation Unit
- How to Draw a Chemical Process Flow Diagram | Chemical and ...
- Football Peatch And Their Label
- Block diagram - Branding strategies | Basic Flowchart Symbols and ...
- Block diagram - Branding strategies | Pyramid Chart Examples ...
- Block diagram - Branding strategies | Marketing Diagrams ...
- Telecommunication Network Diagrams | Telecommunication ...
- Workflow Diagram Examples
- Basketball Court Diagram and Basketball Positions | ConceptDraw ...
- Marketing diagrams - Vector stencils library | Draw Flowcharts with ...
- A Well Label Diagram Of Network Database Process In Computer
- Draw A Well Labelled Diagram Of A Flow Chart
- Block diagram - Branding strategies | Top brand model - Pyramid ...
- Draw And Label The Diagram Of Football


