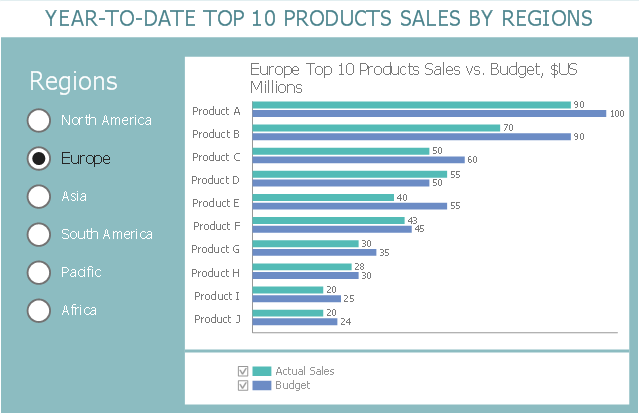
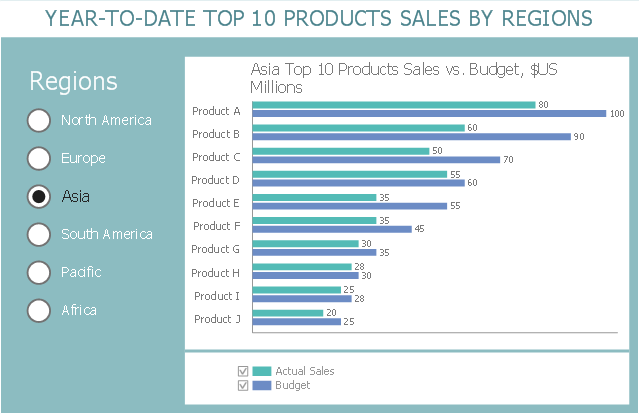
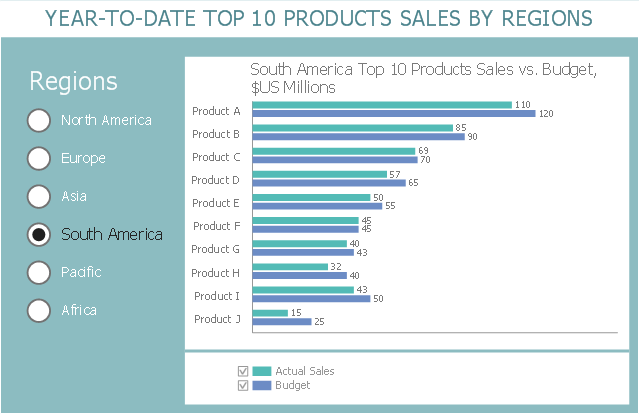
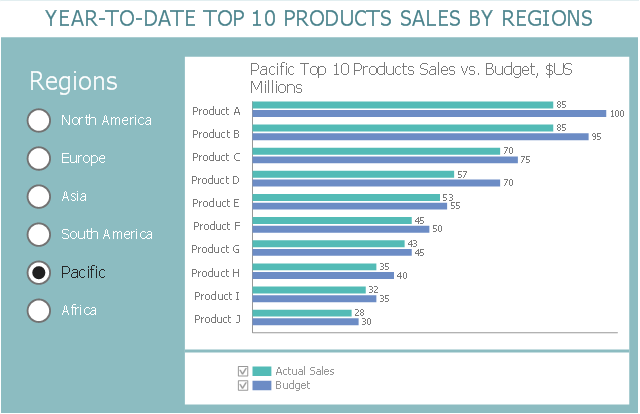
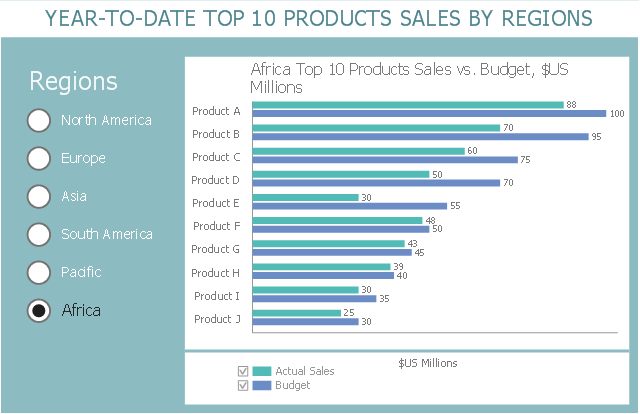
This business intelligence dashboard sample shows the year-to-date top 10 products sales by regions using horizontal bar charts.
"Dashboards often provide at-a-glance views of KPIs (key performance indicators) relevant to a particular objective or business process (e.g. sales, marketing, human resources, or production). In real-world terms, "dashboard" is another name for "progress report" or "report."" [Dashboard (business). Wikipedia]
The BI dashboard example "Year-to-date Top 10 Products Sales by Regions" was created using ConceptDraw PRO software extended with the Business Intelligence Dashboards solution from the Business Processes area of ConceptDraw Solution Park.
North America

Europe
Asia
South America
Pacific
Africa
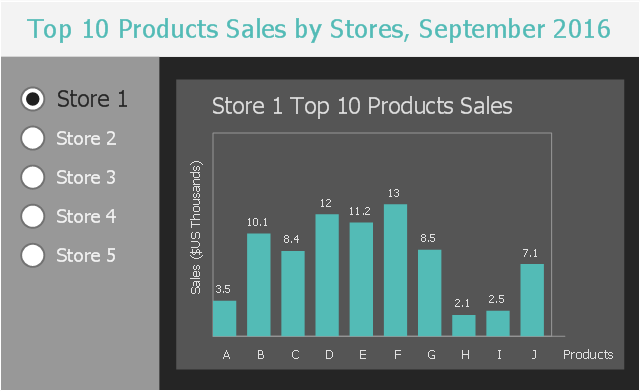
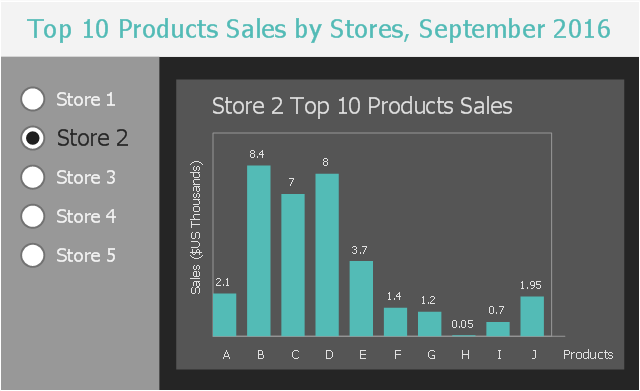
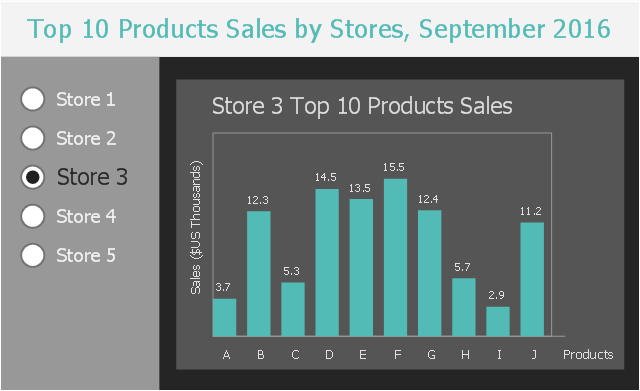
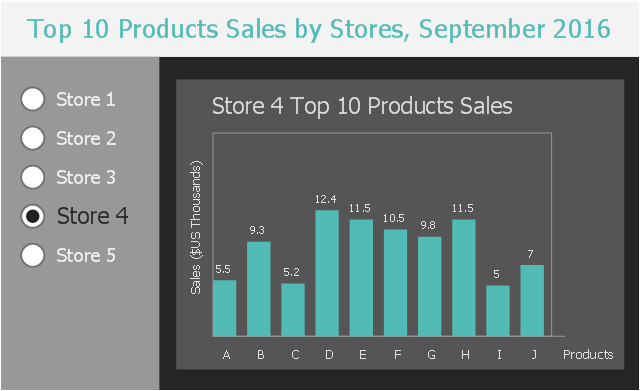
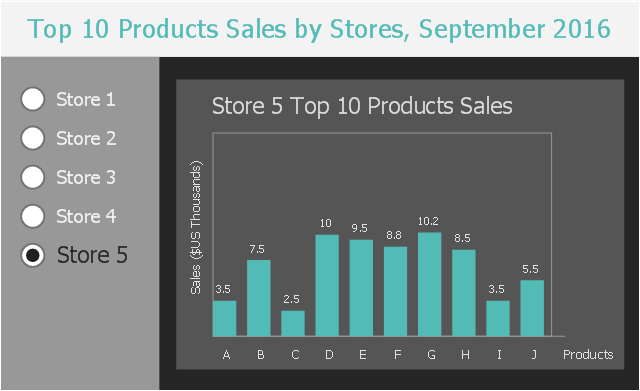
This business intelligence dashboard sample shows the top 10 products sales by stores in September, 2016 using vertical bar charts.
"Bar graphs/ charts provide a visual presentation of categorical data. Categorical data is a grouping of data into discrete groups, such as months of the year, age group, shoe sizes, and animals. These categories are usually qualitative. In a column bar chart, the categories appear along the horizontal axis; the height of the bar corresponds to the value of each category." [Bar chart. Wikipedia]
The BI dashboard example "Top 10 Products Sales by Stores, September 2016" was created using ConceptDraw PRO software extended with the Business Intelligence Dashboards solution from the Business Processes area of ConceptDraw Solution Park.
Store 1
Store 2
Store 3
Store 4
Store 5
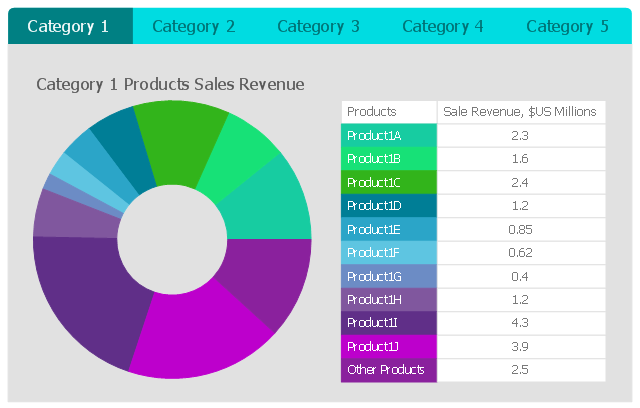
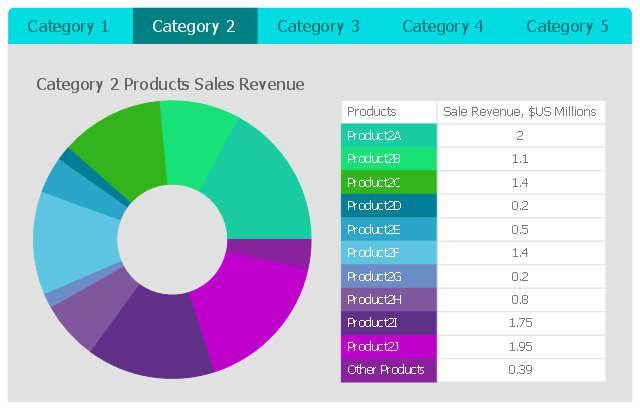
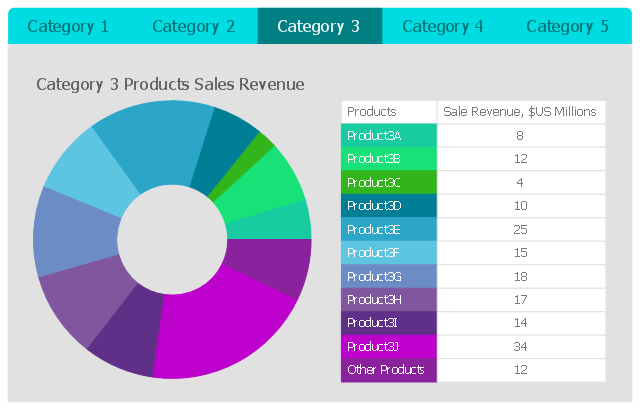
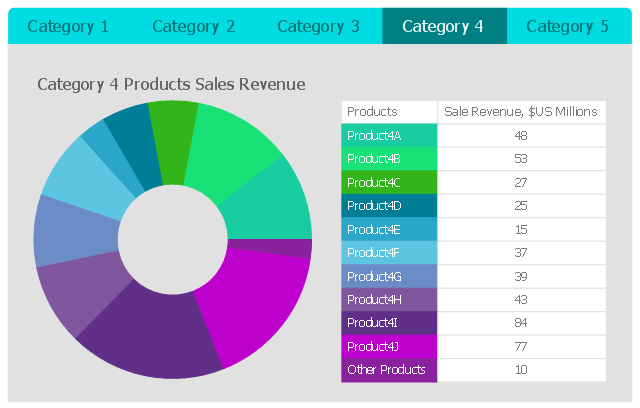
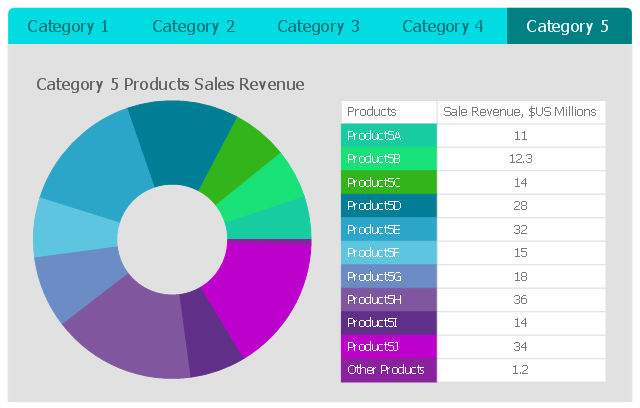
This business intelligence dashboard sample shows the quarter sales revenue for top 10 products by categories using donut charts.
"A doughnut chart (also spelled donut) is a variant of the pie chart, with a blank center allowing for additional information about the data as a whole to be included." [Pie chart. Wikipedia]
The BI dashboard example "Quarter Sales Revenue for Top 10 Products by Categories" was created using ConceptDraw PRO software extended with the Business Intelligence Dashboards solution from the Business Processes area of ConceptDraw Solution Park.
Category 1
Category 2
Category 3
Category 4
Category 5
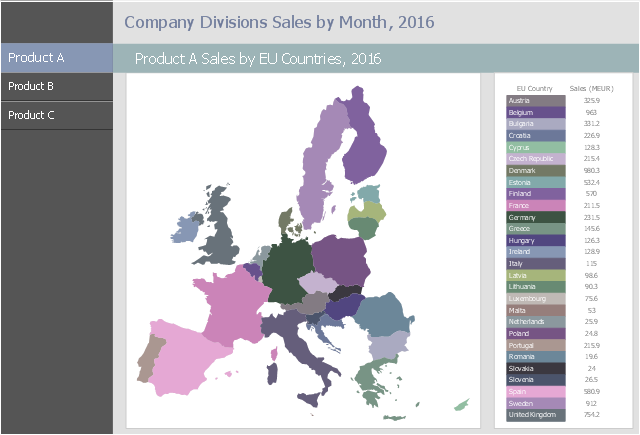
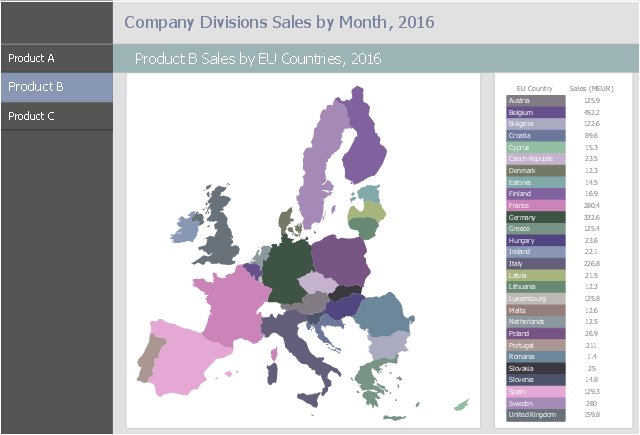
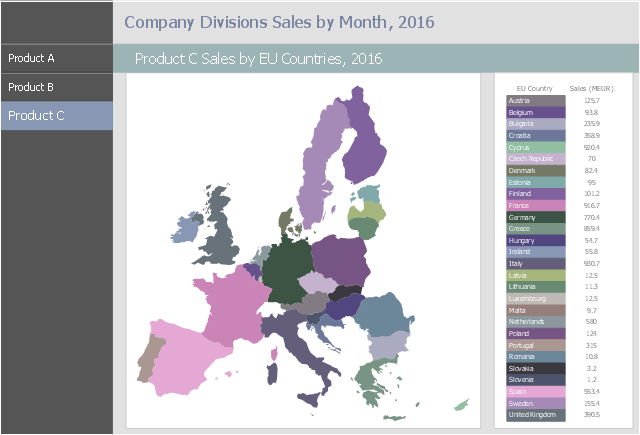
This business intelligence dashboard sample shows the three products sales by EU Countries in 2016 using thematic maps.
"A thematic map is a map that focuses on a specific theme or subject area. ... Thematic maps emphasize spatial variation of one or a small number of geographic distributions." [Thematic map. Wikipedia]
The BI dashboard example "Products A, B and C Sales by EU Countries, 2016" was created using ConceptDraw PRO software extended with the Business Intelligence Dashboards solution from the Business Processes area of ConceptDraw Solution Park.
Product A
Product B
Product C
This business intelligence dashboard sample shows the year-to-date top 10 products sales by regions using horizontal bar charts.
"Dashboards often provide at-a-glance views of KPIs (key performance indicators) relevant to a particular objective or business process (e.g. sales, marketing, human resources, or production). In real-world terms, "dashboard" is another name for "progress report" or "report."" [Dashboard (business). Wikipedia]
The BI dashboard example "Year-to-date Top 10 Products Sales by Regions" was created using ConceptDraw PRO software extended with the Business Intelligence Dashboards solution from the Business Processes area of ConceptDraw Solution Park.
"Dashboards often provide at-a-glance views of KPIs (key performance indicators) relevant to a particular objective or business process (e.g. sales, marketing, human resources, or production). In real-world terms, "dashboard" is another name for "progress report" or "report."" [Dashboard (business). Wikipedia]
The BI dashboard example "Year-to-date Top 10 Products Sales by Regions" was created using ConceptDraw PRO software extended with the Business Intelligence Dashboards solution from the Business Processes area of ConceptDraw Solution Park.
North America
Europe
Asia
South America
Pacific
Africa
The vector stencils library "Sales workflow" contains 39 sales workflow symbols.
Use these sales icon set to draw your sales flowcharts, workflow diagrams and process charts with the ConceptDraw PRO diagramming and vector drawing software.
The sales pictograms library "Sales workflow" is included in the Sales Flowcharts solution from the Marketing area of ConceptDraw Solution Park.
Accounting software
Accounts

Activities

ATM
Call-taker, man

Call-taker, woman

Cash register

Contacts

Credit card transactions

Dealer

Direct mail

Dispatcher, man

Dispatcher, woman

Distribution point

Electronic mall

Invoice

Landing page

Lead

Lead conversion

Leads

New products

Nurturing

Online bank

Online order

Online payment

Products on sale

Product database

Product

Opportunities

Prospects

Proforma invoice

Sales

Sales funnel

Sales manager, man

Sales manager, woman

Sales orders

Sales representative

Shipping provider

Social profile

The vector stencils library "Sales workflow" contains 39 sales workflow symbols.
Use these sales icon set to draw your sales flowcharts, workflow diagrams and process charts with the ConceptDraw PRO diagramming and vector drawing software.
The sales pictograms library "Sales workflow" is included in the Sales Flowcharts solution from the Marketing area of ConceptDraw Solution Park.
Use these sales icon set to draw your sales flowcharts, workflow diagrams and process charts with the ConceptDraw PRO diagramming and vector drawing software.
The sales pictograms library "Sales workflow" is included in the Sales Flowcharts solution from the Marketing area of ConceptDraw Solution Park.
Accounting software
Accounts
Activities
ATM
Call-taker, man
Call-taker, woman
Cash register
Contacts
Credit card transactions
Dealer
Direct mail
Dispatcher, man
Dispatcher, woman
Distribution point
Electronic mall
Invoice
Landing page
Lead
Lead conversion
Leads
New products
Nurturing
Online bank
Online order
Online payment
Products on sale
Product database
Product
Opportunities
Prospects
Proforma invoice
Sales
Sales funnel
Sales manager, man
Sales manager, woman
Sales orders
Sales representative
Shipping provider
Social profile
 Sales Dashboard
Sales Dashboard solution extends ConceptDraw PRO software with templates, samples and library of vector stencils for drawing the visual dashboards of sale metrics and key performance indicators (KPI).
 Sales Dashboard
Sales Dashboard solution extends ConceptDraw PRO software with templates, samples and library of vector stencils for drawing the visual dashboards of sale metrics and key performance indicators (KPI).
 Business Intelligence Dashboard
Business Intelligence Dashboard solution extends the ConceptDraw PRO v11 functionality with exclusive tools, numerous ready-to-use vector objects, samples and quick-start templates for creation professional Business Intelligence Dashboards, Business Intelligence Graphics, Business Intelligence Charts and Maps of different kinds. Design easy the BI dashboard, BI model or Dynamic chart in ConceptDraw PRO to monitor the company's work, to track the indicators corresponding your company's data, to display and analyze key performance indicators, to evaluate the trends and regularities of the processes occurring at the company.
- Sales Process Flowchart. Flowchart Examples | Sales Process ...
- Sales Process Flowchart. Flowchart Examples | Process Flowchart ...
- Process Flowchart | Sales Process Flowchart. Flowchart Examples ...
- Sales Process Map | Sales Process Steps | Flowchart of Products ...
- Entity Relationship Diagram For Product Sales Management
- Sales Process Flowchart. Flowchart Examples | Example of DFD for ...
- Year-to-date Top 10 Products Sales by Regions | Map of Continents ...
- Examples Er Diagram Of Sales Department
- Software development with ConceptDraw Products | Sales Process ...
- Flow chart Example. Warehouse Flowchart | Sales Steps | Software ...
- Sales Growth. Bar Graphs Example | Chart Maker for Presentations ...
- A Flow Chart To Explain The Sales And Dispatch Of Product At A
- Flowchart of Products . Flowchart Examples | Process Flowchart ...
- Sales Process Flowchart. Flowchart Examples | Competitor Analysis ...
- Year-to-date Top 10 Products Sales by Regions
- Data Visualization Solutions | Quarter Sales Revenue for Top 10 ...
- Competitor Analysis | Marketing | Design elements - Sales KPIs and ...
- Flowchart of Products . Flowchart Examples | Product life cycle ...
- Top 10 Products Sales by Stores, September 2016
- Sales Process Flowchart. Flowchart Examples | Marketing and Sales ...