How To Create Project Report

Project — Working With Tasks

Project — Assigning Resources


How to Discover Critical Path on a Gantt Chart

What Constitutes a Project?

Project — Working With Costs

Project —Task Trees and Dependencies

Business Graphics Software
How to Create Presentation of Your Project Gantt Chart

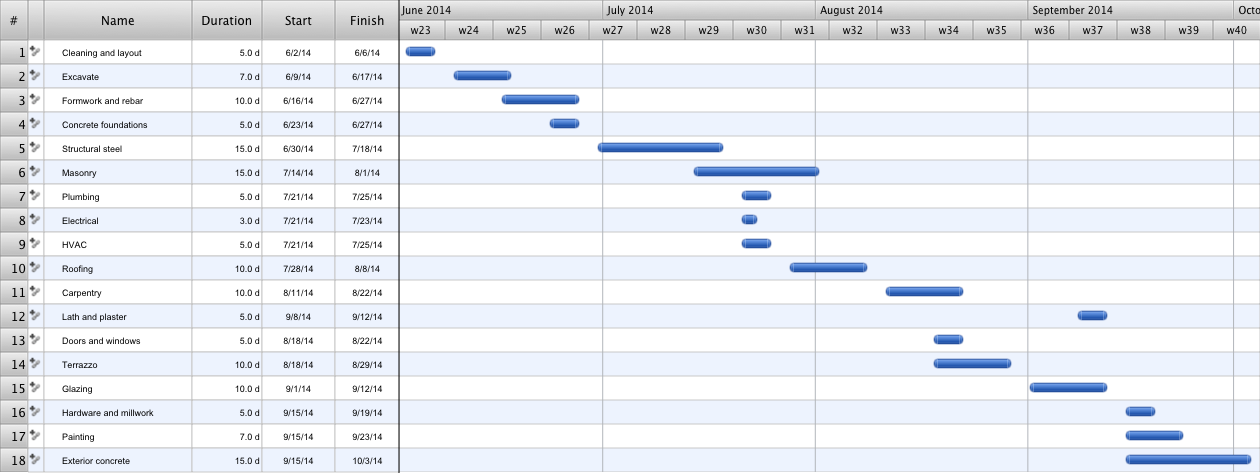
Construction Project Chart Examples
Critical Path Method in ConceptDraw PROJECT

Business Diagram Software


HelpDesk
How to Create Project Dashboard on Mac

PERT Chart Software

- PM Dashboards | How To Create Project Report | Project ...
- Project Management Dashboards Examples
- Marketing Diagrams | Circular Diagram | Loyalty Program Dashboard
- Health IT dashboard | UML Use Case Diagram Example Social ...
- Project —Task Trees and Dependencies | Project management task ...
- Football | Program Dashboard Strategy American Football
- ConceptDraw Dashboard for Facebook | Program Evaluation and ...
- Ms Project Dashboard Report
- Status Dashboard | How to Report on Multiple Projects Status ...
- How to Report on Multiple Projects Status | PM Dashboards | PM ...
- The Best Drawing Program for Mac | Business Graphics Software ...
- Program Portfolio Dashboard
- Program Status Dashboard
- PM Dashboards | How To Create Project Report | A KPI Dashboard ...
- PM Dashboards | How To Create Project Report | Status Dashboard ...
- Health IT dashboard | Event-driven Process Chain (EPC) Diagrams ...
- How to Create Project Dashboard on Mac | How to Create Multiple ...
- Divided Bar Diagrams | The Best Drawing Program for Mac ...
- Seating Plans | Business Intelligence Dashboard | Basketball | Flow ...
- Construction Project Chart Examples | PM Dashboards | Best Tool ...