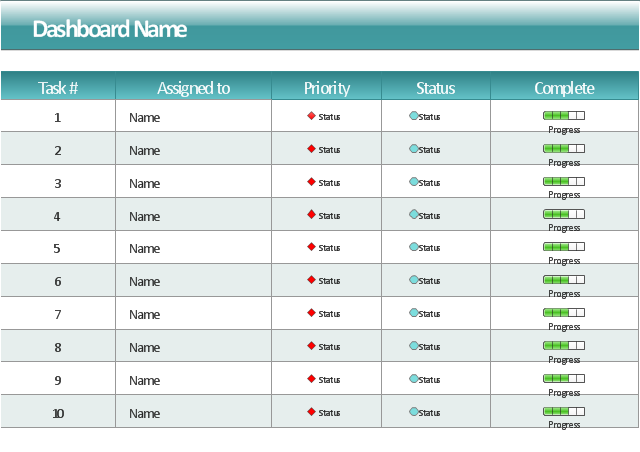
This project task status dashboard template display the task table consisting of the columns for task number, assignment (responsible person name), priority, status and complete. The task priority and status are indicated with alert visual indicators. The task complete is showed by progress indicators.
The template "Project task status dashboard" for the ConceptDraw PRO diagramming and vector drawing software is included in the Status Dashboard solution from the area "What is a Dashboard" of ConceptDraw Solution Park.
The template "Project task status dashboard" for the ConceptDraw PRO diagramming and vector drawing software is included in the Status Dashboard solution from the area "What is a Dashboard" of ConceptDraw Solution Park.
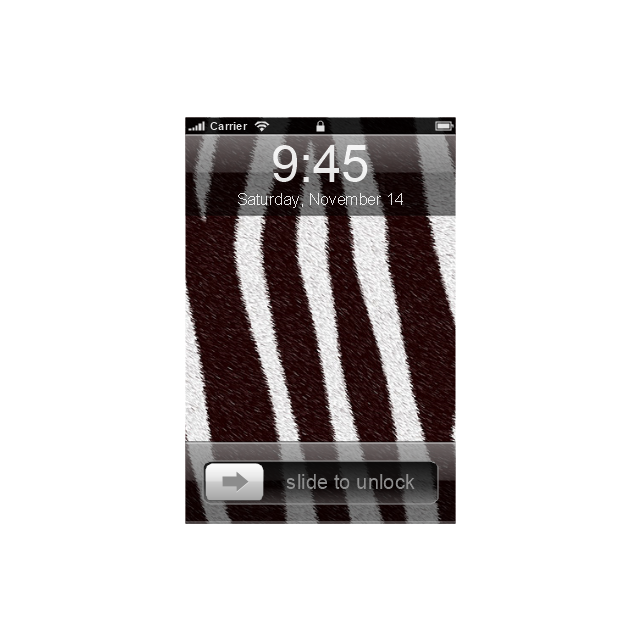
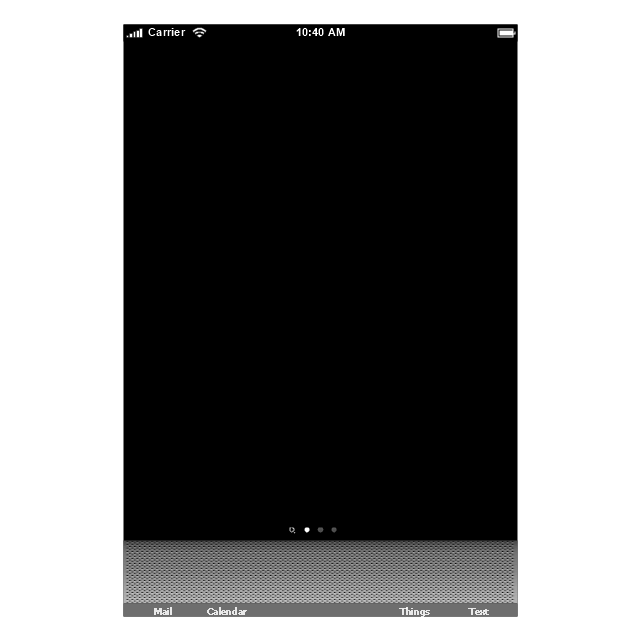
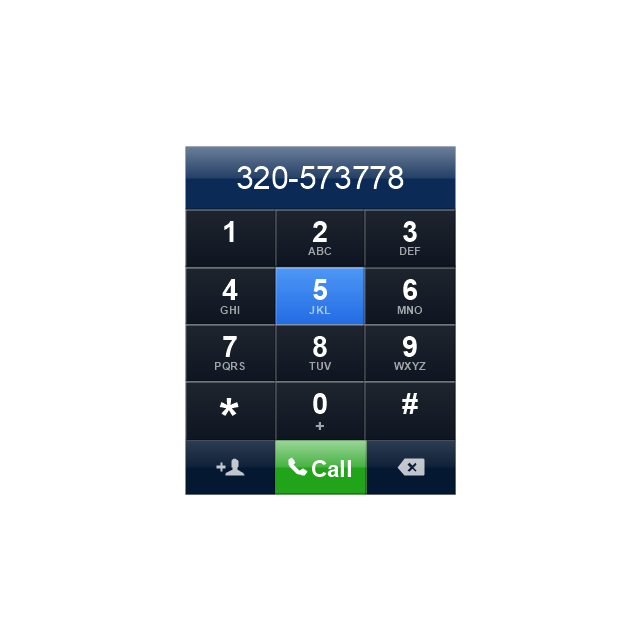
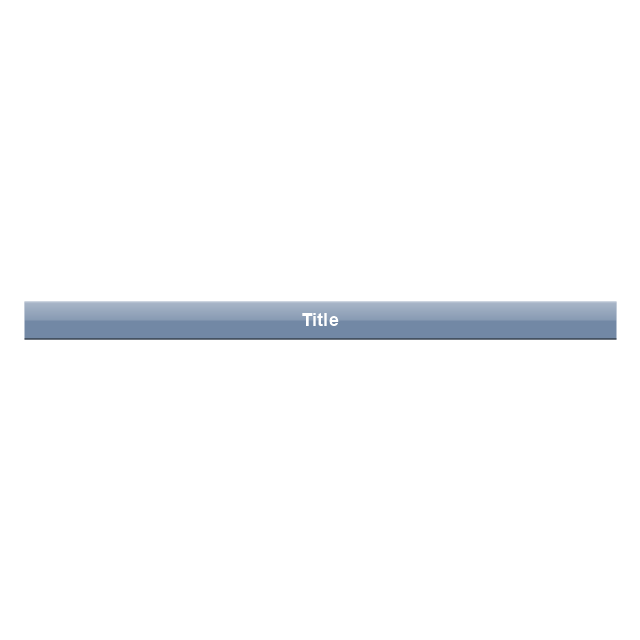
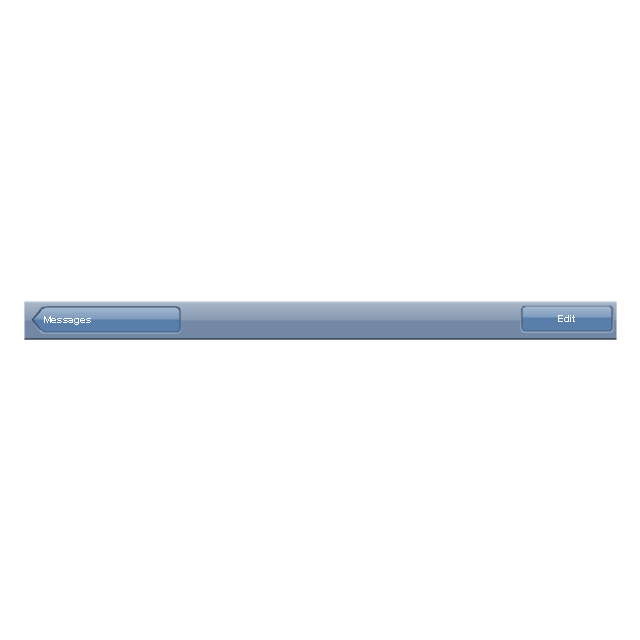
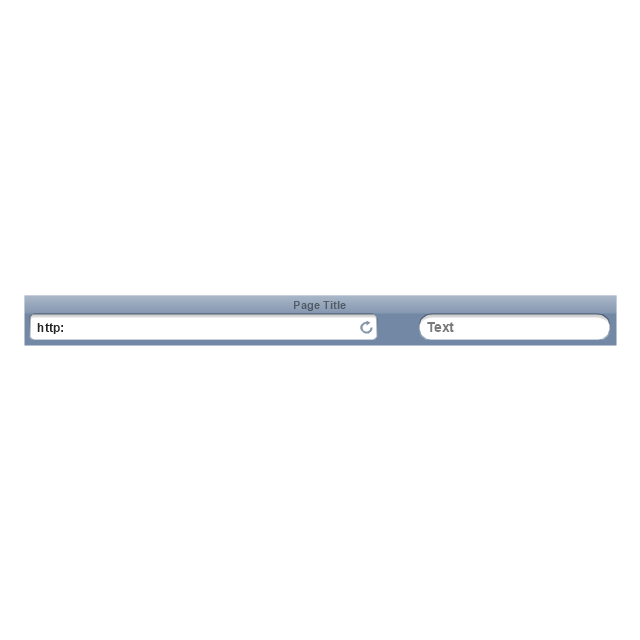
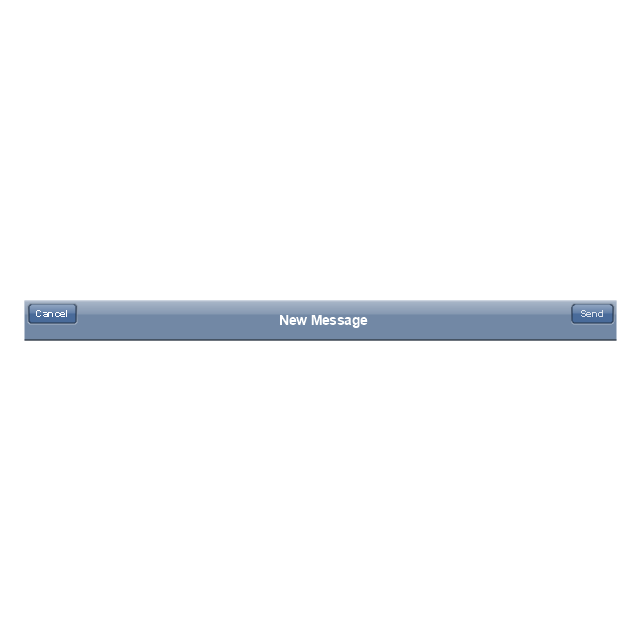
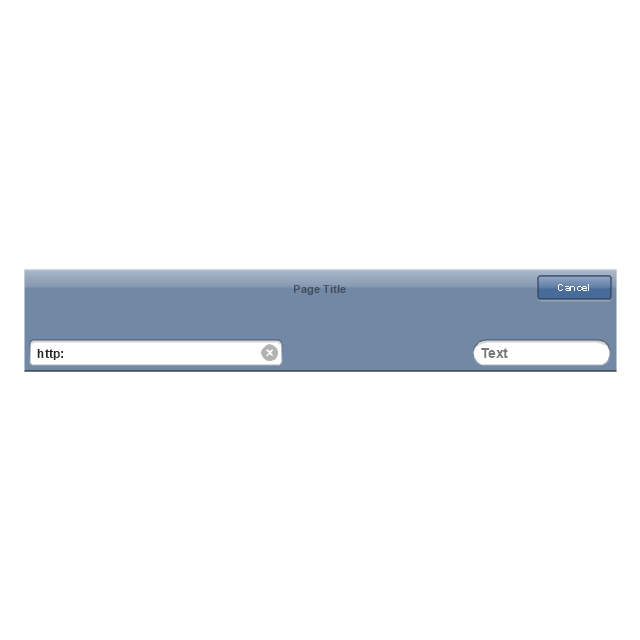
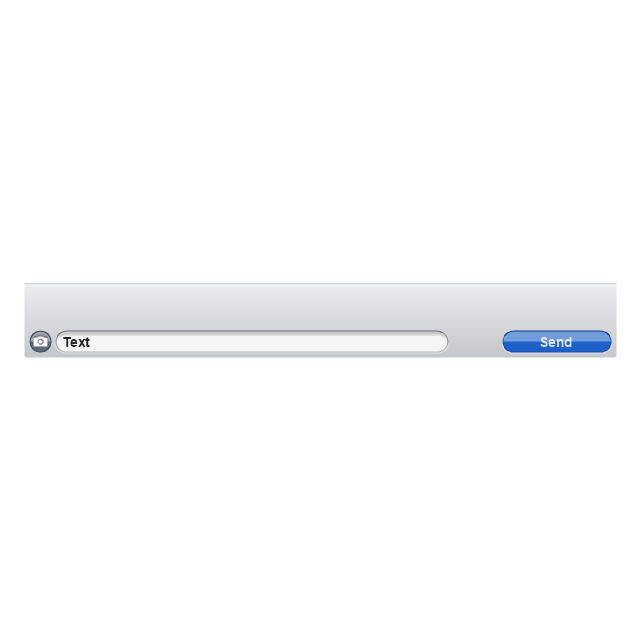
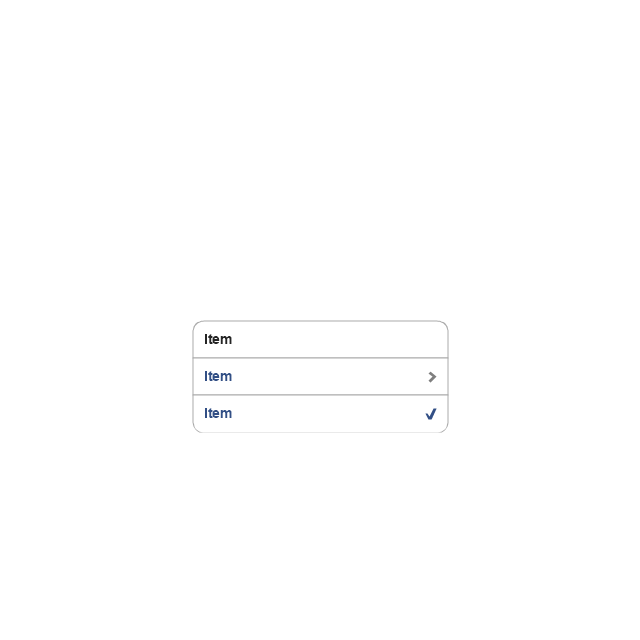
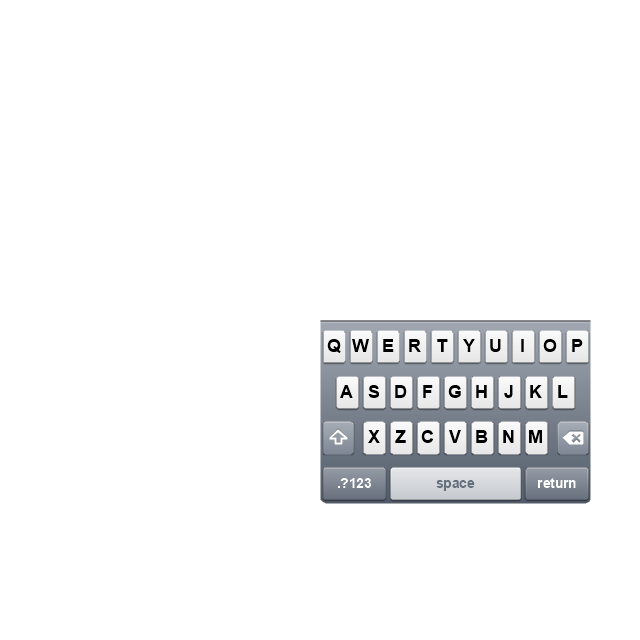
The vector stencils library "iPhone interface" contains 119 iPhone UI design elements.
Use it for development of graphic user interface (GUI) for iPhone software applications in the ConceptDraw PRO diagramming and vector drawing software extended with the Graphic User Interface solution from the Software Development area of ConceptDraw Solution Park.
Use it for development of graphic user interface (GUI) for iPhone software applications in the ConceptDraw PRO diagramming and vector drawing software extended with the Graphic User Interface solution from the Software Development area of ConceptDraw Solution Park.
Gantt Chart Software
The Gantt Chart is the main interface in ConceptDraw PROJECT. It summarizes the tasks in your project and presents them graphically so you can easily view your progress.The vector stencils library "Controls" contains 53 icons of Windows 8 controls.
Use it to design graphic user interface (GUI) prototypes of your software applications for Windows 8.
"A graphical control element or widget is an element of interaction in a graphical user interface (GUI), such as a button or a scroll bar. Controls are software components that a computer user interacts with through direct manipulation to read or edit information about an application. ...
Each widget facilitates a specific type of user-computer interaction, and appears as a visible part of the application's GUI as defined by the theme and rendered by the rendering engine. The theme makes all graphical control elements adhere to a unified aesthetic design and creates a sense of overall cohesion. Some widgets support interaction with the user, for example labels, buttons, and check boxes. Others act as containers that group the widgets added to them, for example windows, panels, and tabs." [Graphical control element. Wikipedia]
The design elements example "Controls - Vector stencils library" was created using the ConceptDraw PRO diagramming and vector drawing software extended with the Windows 8 User Interface solution from the Software Development area of ConceptDraw Solution Park.
The vector stencils library "iPhone interface" contains 119 iPhone UI design elements.
Use it for development of graphic user interface (GUI) for iPhone software applications in the ConceptDraw PRO diagramming and vector drawing software extended with the Graphic User Interface solution from the Software Development area of ConceptDraw Solution Park.
Use it for development of graphic user interface (GUI) for iPhone software applications in the ConceptDraw PRO diagramming and vector drawing software extended with the Graphic User Interface solution from the Software Development area of ConceptDraw Solution Park.
Cross-Functional Flowchart
Use of Cross-Functional Flowchart is a clear way of showing each team member’s responsibilities and how processes get shared or transferred between different responsible people, teams and departments. Use the best flowchart maker ConceptDraw PRO with a range of standardized cross-functional flowchart symbols to create the Cross-Functional Flowcharts simply and to visualize the relationship between a business process and the functional units responsible for that process. To draw the most quickly Cross-Functional Flowcharts, Cross Functional Process Maps, or Cross Functional Process Flow Diagrams, start with a Cross-functional flowchart samples and templates from ConceptDraw Solution Park. The ConceptDraw Arrows10 and RapidDraw technologies will be also useful for you in drawing. ConceptDraw PRO supports designing both types - horizontal and vertical Cross-functional flowcharts. A vertical layout makes the accents mainly on the functional units while a horizontal layout - on the process. If you need a Visio alternative in Mac OS X, try ConceptDraw PRO. Its interface is very intuitive and it’s actually much easier to use than Visio, yet somehow it’s just as powerful if not more so. ConceptDraw PRO performs professional quality work and seamless Visio interaction.
Gant Chart in Project Management
Gantt Chart is a graphical representation of tasks as segments on a time scale. It helps plan and monitor project development or resource allocation. There are list of tasks, project milesones and stages. The horizontal axis is a time scale, expressed either in absolute or relative time. Gantt chart can be used for planning in virtually any industry. There are major project planning tools using gantt chart for creating project plan. For instance, using ConceptDraw PROJECT together with ConceptDraw MINDMAP for planning marketing actions is very effective way. It makes ConceptDraw Office best marketing project management software for gantt chart planning marketing message, scheduling stages when to send massive text messages or when use email marketing services in specific projects. There are simple steps on how to use project management software for marketing, sales actions and product support. This is simple all in one toolbox for managers who need best project management software for small business as for planning and brainstorming as for reporting at project execution stage. Using gantt charts together with mindmap visuals and professional presentations charts make it excellent creative project management software. ConceptDraw PROJECT is portfolio project management software it allows manage many projects with multi gantt chart.
Waterfall Bar Chart
Waterfall chart shows the changing of the value from one state to another through the series of intermediate changes. The waterfall diagrams are widely used in the business. They are used to represent the set of figures and allow link the individual values to the whole.
 Status Dashboard
Status dashboard solution extends ConceptDraw PRO software with templates, samples and vector stencils libraries with graphic indicators for drawing the visual dashboards showing status data.
Scrum process work items and workflow
Teams working with Scrum methodology use the product backlog items (PBIs), bug work item types (WITs), reports and dashboards. SCRUM Workflow solution for ConceptDraw PRO software offers collection of samples, variety of predesigned objects, clipart and graphic elements, a set of Scrum process work items and workflow which are developed for agile teams working using Scrum.Diagrams Mean Nothing
You are probably familiar with diagrams. But have you ever thought that they are useless? This article will explain you why.
 Android User Interface
The Android User Interface solution allows ConceptDraw PRO act as an Android UI design tool. Libraries and templates contain a variety of Android GUI elements to help users create images based on Android UI design.
- Progress Bar Gif Image
- Progress Bar Images Png
- How To Show Project Progress Peport on Web | iPhone interface ...
- Progress Bar Templates
- Project Assignment Table
- Design elements - Tables | Gantt Chart Software | How to Create ...
- Project Progress Status Dashboard
- Progress Bar Project
- Divided bar diagrams - Vector stencils library | Divided bar diagrams ...
- Task Table Priority
- Status Table
- Tables - Vector stencils library | Arrows - Vector clipart library | Solid ...
- Design elements - Toolbar and Navigation Bar Buttons | How To ...
- iPhone interface - Vector stencils library | iPhone OS (iOS) graphic ...
- Design elements - Toolbar and Navigation Bar Buttons | iPhone ...
- iPhone interface - Vector stencils library | Statusbar Design Progress
- Volume Bar Png
- Progress Bar Icon Png
- Progress Bar Blue Png
- Circle Progress Bar Vector Image Png


-iphone-interface---vector-stencils-library.png--diagram-flowchart-example.png)
-iphone-interface---vector-stencils-library.png--diagram-flowchart-example.png)






-iphone-interface---vector-stencils-library.png--diagram-flowchart-example.png)




-iphone-interface---vector-stencils-library.png--diagram-flowchart-example.png)
-iphone-interface---vector-stencils-library.png--diagram-flowchart-example.png)
-iphone-interface---vector-stencils-library.png--diagram-flowchart-example.png)
-iphone-interface---vector-stencils-library.png--diagram-flowchart-example.png)

