The vector stencils library "Status indicators" contains 41 visual status indicators. Each status indicator can visualize one of 2-6 information states and have a caption.
Use it to create your business performance dashboards in the ConceptDraw PRO diagramming and vector drawing software extended with the Status Dashboard solution from the area "What is a Dashboard" of ConceptDraw Solution Park.
Use it to create your business performance dashboards in the ConceptDraw PRO diagramming and vector drawing software extended with the Status Dashboard solution from the area "What is a Dashboard" of ConceptDraw Solution Park.
2-State Alert, Red

2-State Alert, Yellow

2-State Alert, Green

2-State Alert, Blue

3-State Alert 1

3-State Alert 2

4-State Alert 1

4-State Alert 2

5-State Alert 1

5-State Alert 2

Forth-Back 1

Forth-Back 2

Back-Forth 1

Back-Forth 2

Up-Down 1

Up-Down 2

Down-Up 1

Down-Up 2

Arrows Up-Down 1

Arrows Up-Down 2

Arrows Down-Up 1

Arrows Down-Up 2

Traffic Light Vertical 1

Traffic Light Vertical 2

Traffic Light Horizontal 1

Traffic Light Horizontal 2

Progress Lights, Green

Progress Lights, Yellow

Progress Lights, Red

5-Stars Rating

Progress Bar, Blue

Progress Bar, Green

Progress Bar, Yellow

Progress Bar, Red

Access

Quality

Switch

Speed

Light Emitting

Shapes Alert 1

Shapes Alert 2

The vector stencils library "Marketing indicators" contains 12 graphic indicators: horizontal bar chart, pie chart, arrow chart, donut chart, square chart, stickman row pictograph, progress bar, bullet indicator, radial gauge, semi-radial gauge.
Use these visual indicators to design your marketing infograms.
The shapes example "Design elements - Marketing indicators" was created using the ConceptDraw PRO diagramming and vector drawing software extended with the Marketing Infographics solition from the area "Business Infographics" in ConceptDraw Solution Park.
Graphic indicators

The vector stencils library "Management indicators" contains 14 visual indicators.
Use it to create your management infogram in the ConceptDraw PRO diagramming and vector drawing software.
The example "Management indicators - Vector stencils library" is included in the solution "Marketing infographics" from the "Business infographics" area of ConceptDraw Solution Park.
Use it to create your management infogram in the ConceptDraw PRO diagramming and vector drawing software.
The example "Management indicators - Vector stencils library" is included in the solution "Marketing infographics" from the "Business infographics" area of ConceptDraw Solution Park.
1-Sector donut chart

1-Sector pie chart

2-Bars horizontal bar chart

2-Columns arrow chart
2-Columns arrow chart 2
2-Sectors donut chart

2-Sectors pie chart

Bullet indicator

Progress bar

Radial gauge

Semi-radial gauge

Square chart 10x10 - filling from above

Square chart 10x10 - filling from below

Stickman row pictograph

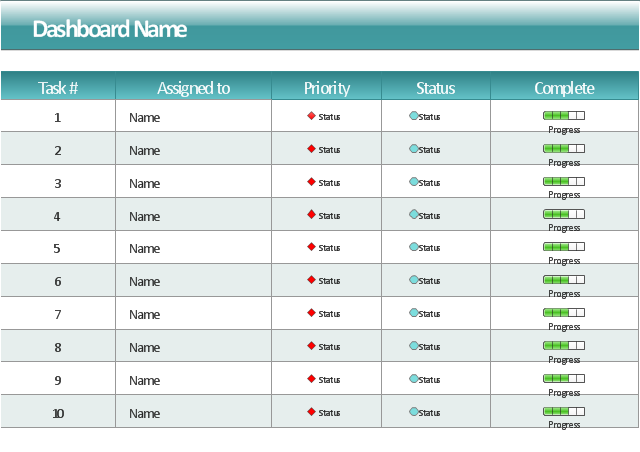
This project task status dashboard template display the task table consisting of the columns for task number, assignment (responsible person name), priority, status and complete. The task priority and status are indicated with alert visual indicators. The task complete is showed by progress indicators.
The template "Project task status dashboard" for the ConceptDraw PRO diagramming and vector drawing software is included in the Status Dashboard solution from the area "What is a Dashboard" of ConceptDraw Solution Park.
The template "Project task status dashboard" for the ConceptDraw PRO diagramming and vector drawing software is included in the Status Dashboard solution from the area "What is a Dashboard" of ConceptDraw Solution Park.
Project task status dashboard template
The vector stencils library "Education indicators" contains 12 graphic indicators.
Use these visual indicators to design your educational infogram.
The vector stencils library "Education indicators" is included in the Education Infographics solution from the Business Infographics area of ConceptDraw Solution Park.
Use these visual indicators to design your educational infogram.
The vector stencils library "Education indicators" is included in the Education Infographics solution from the Business Infographics area of ConceptDraw Solution Park.
1-Sector donut chart

2-Sectors donut chart

1-Sector pie chart

2-Sectors pie chart

2-Bars horizontal bar chart

2-Columns arrow chart
Bullet indicator

Progress bar

Radial gauge

Semi-radial gauge

Square chart 10x10 - filling from above

Stickman row pictograph


 Status Dashboard
Status dashboard solution extends ConceptDraw PRO software with templates, samples and vector stencils libraries with graphic indicators for drawing the visual dashboards showing status data.
Gantt charts for planning and scheduling projects

HelpDesk
How to Create a Timeline Diagram in ConceptDraw PRO

- Speedometer Progress Visual
- Performance Indicators | Design elements - Composition charts and ...
- Examples Of Visual Indicators
- Project Progress Status Dashboard
- Progress Bar Templates
- Traffic Condition Dashboard
- Education indicators - Vector stencils library | Management ...
- Progress Bar Template
- Design elements - Meter indicators | Sales performance dashboard ...
- Status Dashboard | Measure the Progress | Dashboard | Progress ...
- Design elements - Meter indicators | Meter Dashboard | Sales ...
- Design elements - Comparison charts and indicators | Composition ...
- Progress Bar Project
- Website traffic dashboard | Status indicators - Vector stencils library ...
- Design elements - Composition charts and indicators | Design ...
- Design elements - Comparison charts and indicators | Design ...
- Process Flowchart | Animated Gif Images For Progress Bar
- Management indicators - Vector stencils library | Sales dashboard ...
- Design elements - IVR Internet | Design Pictorial Infographics ...
- Status indicators - Vector stencils library | Design elements - Status ...