HelpDesk
How to Track Your Project Plan vs. the Actual Project Condition

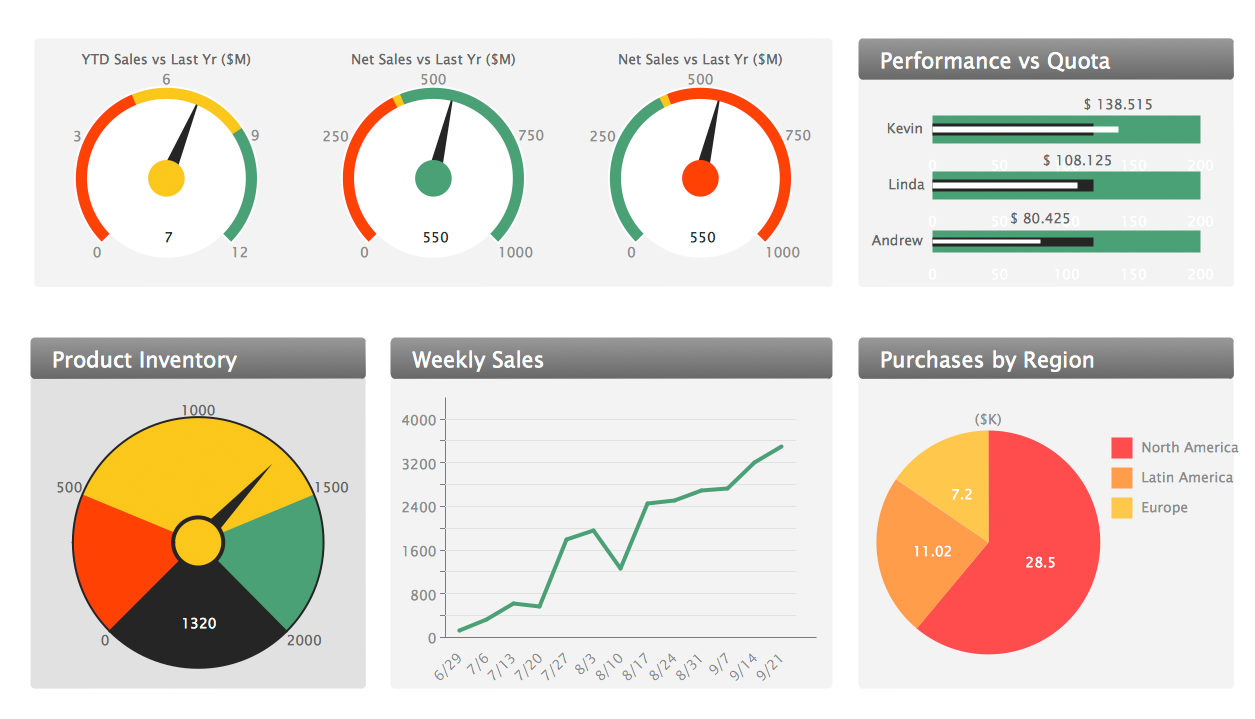
KPI Dashboard

"As a discipline, task management embraces several key activities. Various conceptual breakdowns exist, and these, at a high-level, always include creative, functional, project, performance and service activities.
Creative activities pertain to task creation. In context, these should allow for task planning, brainstorming, creation, elaboration, clarification, organization, reduction, targeting and preliminary prioritization.
Functional activities pertain to personnel, sales, quality or other management areas, for the ultimate purpose of ensuring production of final goods and services for delivery to customers. In context these should allow for planning, reporting, tracking, prioritizing, configuring, delegating, and managing of tasks.
Project activities pertain to planning and time and costs reporting. These can encompass multiple functional activities but are always greater and more purposeful than the sum of its parts. In context project activities should allow for project task breakdown, task allocation, inventory across projects, and concurrent access to task databases.
Service activities pertain to client and internal company services provision, including customer relationship management and knowledge management. In context these should allow for file attachment and links to tasks, document management, access rights management, inventory of client & employee records, orders & calls management, and annotating tasks.
Performance activities pertain to tracking performance and fulfillment of assigned tasks. In context these should allow for tracking by time, cost control, stakeholders and priority; charts, exportable reports, status updates, deadline adjustments, and activity logging.
Report activities pertain to the presentation of information regarding the other five activities listed, including graphical display." [Task management. Wikipedia]
The example "Project tasks dashboard" was created using the ConceptDraw PRO diagramming and vector drawing software extended with the Status Dashboard solution from the area "What is a Dashboard" of ConceptDraw Solution Park.
Project tasks dashboard

"Task management is the process of managing tasks through its life cycle. It involves planning, testing, tracking and reporting. Task management can help either individuals achieve goals, or groups of individuals collaborate and share knowledge for the accomplishment of collective goals. Tasks are also differentiated by complexity, from low to high.
Effective task management requires managing all aspects of a task, including its status, priority, time, human and financial resources assignments, recurrency, notifications and so on. These can be lumped together broadly into the basic activities of task management. ...
Task management may form part of project management and process management and can serve as the foundation for efficient workflow in an organisation. Project managers adhering to task-oriented management have a detailed and up-to-date project schedule, and are usually good at directing team members and moving the project forward. ...
Task life cycle.
The status of tasks can be described by the following states:
Ready,
Assigned,
Terminated,
Expired,
Forwarded,
Finished,
Failed." [Task management. Wikipedia]
The example "Project management task status dashboard" was created using the ConceptDraw PRO diagramming and vector drawing software extended with the Status Dashboard solution from the area "What is a Dashboard" of ConceptDraw Solution Park.
Status dashboard

Sales Dashboard
 Note Exchange
This solution extends ConceptDraw MINDMAP software with the ability to exchange with Evernote, and access mind maps anywhere, on any computer or mobile device via Evernote.
Dashboard

Performance Indicators

Business Graphics Software
- How to Report on Multiple Projects Status | PM Dashboards | Project ...
- Progress Dashboard Examples
- Project Progress Status Dashboard
- PM Dashboards | Project management task status dashboard ...
- Status Dashboard | Projects HR dashboard | A KPI Dashboard ...
- ConceptDraw News | What is a Dashboard , and Why Should Your ...
- Status Dashboard | Status indicators - Vector stencils library | Project ...
- Construction Progress Chart Sample
- Status Dashboard | Project task status dashboard - Template | PM ...
- Project Progress Dashboard