Bubble diagrams in Landscape Design with ConceptDraw DIAGRAM
Bubble Diagrams are the charts with a bubble presentation of data with obligatory consideration of bubble's sizes. They are analogs of Mind Maps and find their application at many fields, and even in landscape design. At this case the bubbles are applied to illustrate the arrangement of different areas of future landscape design, such as lawns, flowerbeds, playgrounds, pools, recreation areas, etc. Bubble Diagram helps to see instantly the whole project, it is easy for design and quite informative, in most cases it reflects all needed information. Often Bubble Diagram is used as a draft for the future landscape project, on the first stage of its design, and in case of approval of chosen design concept is created advanced detailed landscape plan with specification of plants and used materials. Creation of Bubble Diagrams for landscape in ConceptDraw DIAGRAM software is an easy task thanks to the Bubble Diagrams solution from "Diagrams" area. You can use the ready scanned location plan as the base or create it easy using the special ConceptDraw libraries and templates.HelpDesk
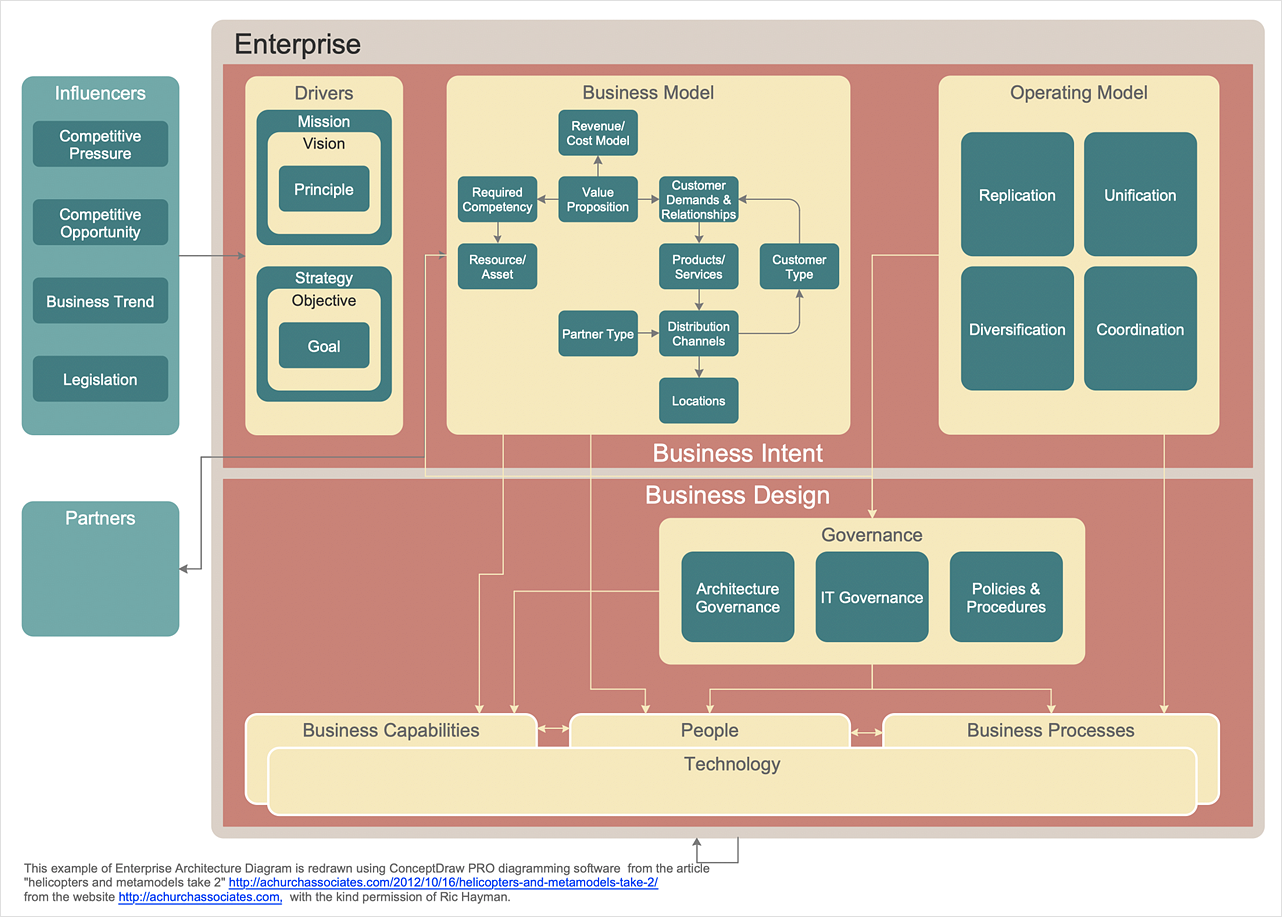
How to Create an Enterprise Architecture Diagram
An Enterprise Architecture (EA) diagram is used to display the structure and operations of an organization. It is used to analyze and document an organization and its business functions, along with the applications and systems on which they are implemented. The aim of an enterprise architecture diagram is to determine how an organization can effectively achieve its current and future objectives. The Enterprise Architecture often uses diagrams to support the decision-making process. ConceptDraw DIAGRAM allows you to design Enterprise Architecture diagrams of any complexity.Making Diagrams Has Never Been Easier
The innovative ConceptDraw DIAGRAM is a powerful drawing tool that changes the way diagrams are produced. While making diagrams has never been easier. This is more than enough versatility to draw any type of diagram with any degree of complexity.HelpDesk
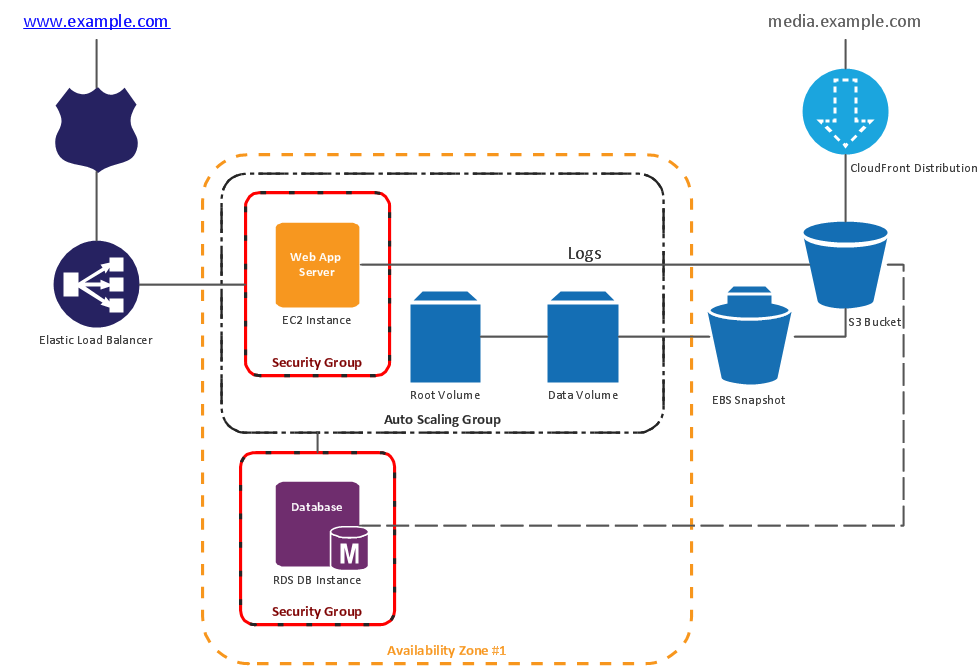
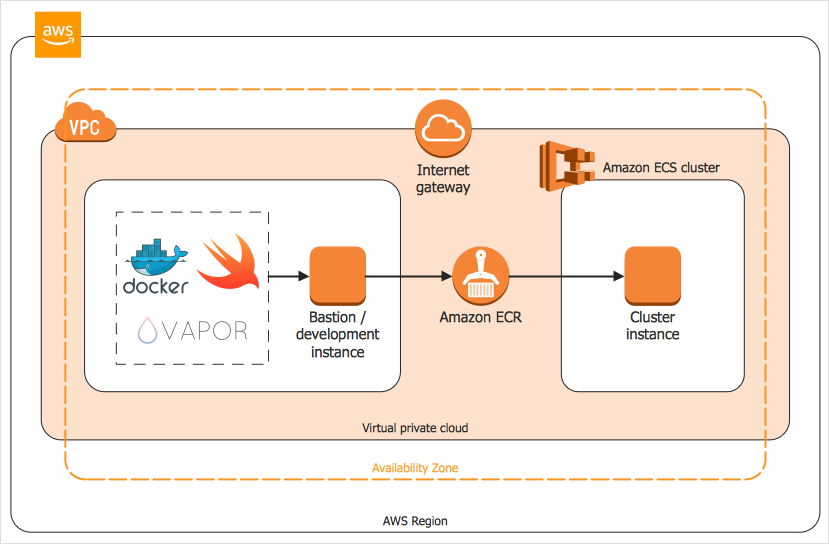
How to Create an AWS Architecture Diagram
Displaying an Amazon Web Service (AWS) cloud actually requires large amounts of attention to detail. Every element of technology has to be addressed: software, middle ware, transaction processing, scaling, data storage; the complete list is staggering. Using the ConceptDraw AWS Architecture Diagrams solution makes much easier the work on documenting the Amazon Web Service architecture. The ConceptDraw AWS Architecture Diagrams solution includes icons, sample and templates for some Amazon Web Services products and resources, to be used when buiding architecture diagrams. The icons are simple so that user can easily incorporate them in his drawings. AWS Architecture Diagrams can be used in presentations, datasheets, or any other technical visualizations.- Architectural Project Flow Chart
- Sample Project Flowchart . Flowchart Examples | How to Create an ...
- Data Flow Diagram Architecture Example
- Basic Flowchart Symbols and Meaning | Bubble diagrams in ...
- Architecture Diagrams In Projects
- Process Flowchart | Cloud Computing Architecture Diagrams ...
- Project management life cycle - Flowchart | Sample Project ...
- Sample Project Flowchart . Flowchart Examples | Top 5 Android Flow ...
- Flowchart Programming Project . Flowchart Examples | Sample ...
- How To Draw Architecture Diagram For Project Like Event Planner
- Process Flowchart | How To create Diagrams for Amazon Web ...
- How to Create a Gantt Chart for Your Project | Enterprise ...
- Workflow Diagrams | Data Flow Diagram | Enterprise Architecture ...
- Process Flowchart | How to Create an Enterprise Architecture ...
- Flowchart Programming Project . Flowchart Examples | Example of ...
- UML Use Case Diagram Example Social Networking Sites Project ...
- Example of DFD for Online Store (Data Flow Diagram ) DFD ...
- Swim Lane Diagrams | Software Work Flow Process in Project ...
- Process Flowchart | Block diagram - Document management system ...
- Basic Flowchart Symbols and Meaning | Technical Flow Chart ...


