 Status Dashboard
Status dashboard solution extends ConceptDraw DIAGRAM software with templates, samples and vector stencils libraries with graphic indicators for drawing the visual dashboards showing status data.
A KPI Dashboard Provides the Answers Your Sales Team
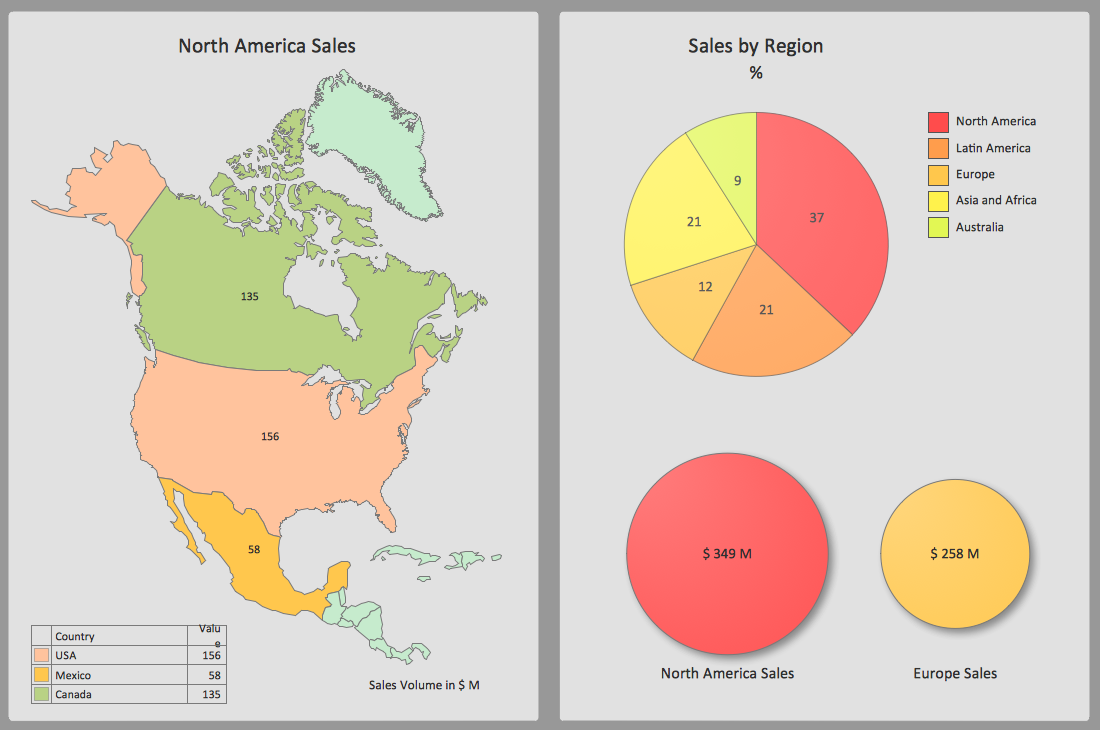
Sales dashboard is a tool that provides the answers to all questions your sales team may have. A mature sales dashboard provides complete set of KPI to shows corporate, team or personal performance to keep sales process clear.HelpDesk
How to Publish Project Reports to a Web Site
Reporting is an important part of project management. Every project manager is regularly asked how the project is progressing. ConceptDraw Office offers different ways in which to provide a project status.HelpDesk
How to Track Your Project Plan vs. the Actual Project Condition
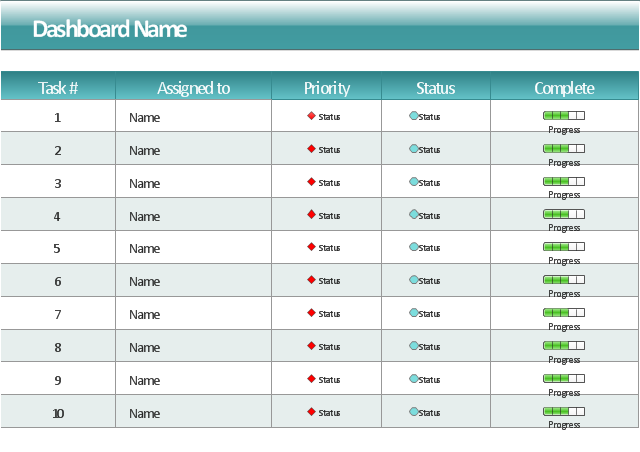
ConceptDraw PROJECT provides a user with the possibility to track how the project is going. Project Manager can compare the actual data with the planned and assess possible measures to resolve issues. ConceptDraw PROJECT has several types of visual reports that can help to assess visually the difference between planned and actual project data.This project task status dashboard template display the task table consisting of the columns for task number, assignment (responsible person name), priority, status and complete. The task priority and status are indicated with alert visual indicators. The task complete is showed by progress indicators.
The template "Project task status dashboard" for the ConceptDraw PRO diagramming and vector drawing software is included in the Status Dashboard solution from the area "What is a Dashboard" of ConceptDraw Solution Park.
The template "Project task status dashboard" for the ConceptDraw PRO diagramming and vector drawing software is included in the Status Dashboard solution from the area "What is a Dashboard" of ConceptDraw Solution Park.
The Facts and KPIs
Visualizing sales data help you see the facts and KPIs about your sales process to make conclusions and see how your business can improve.HelpDesk
How to Create Project Dashboard on PC
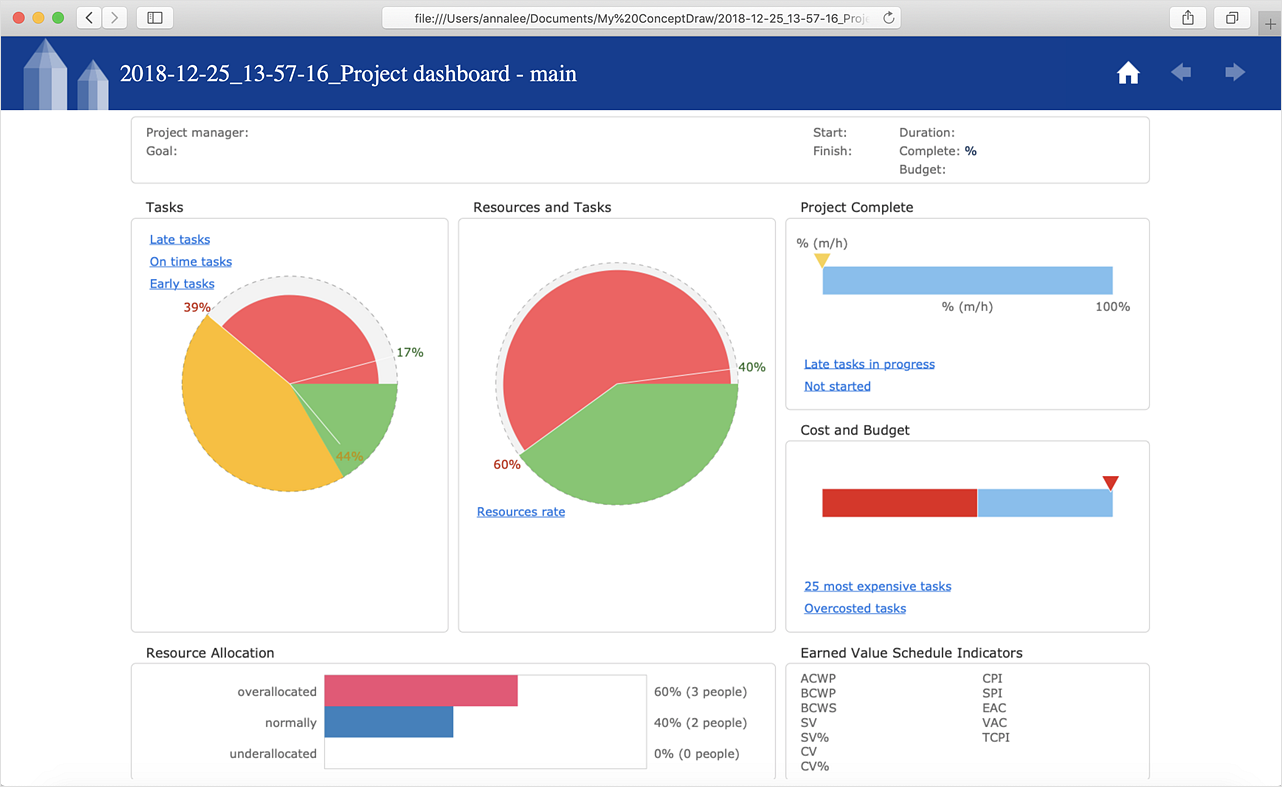
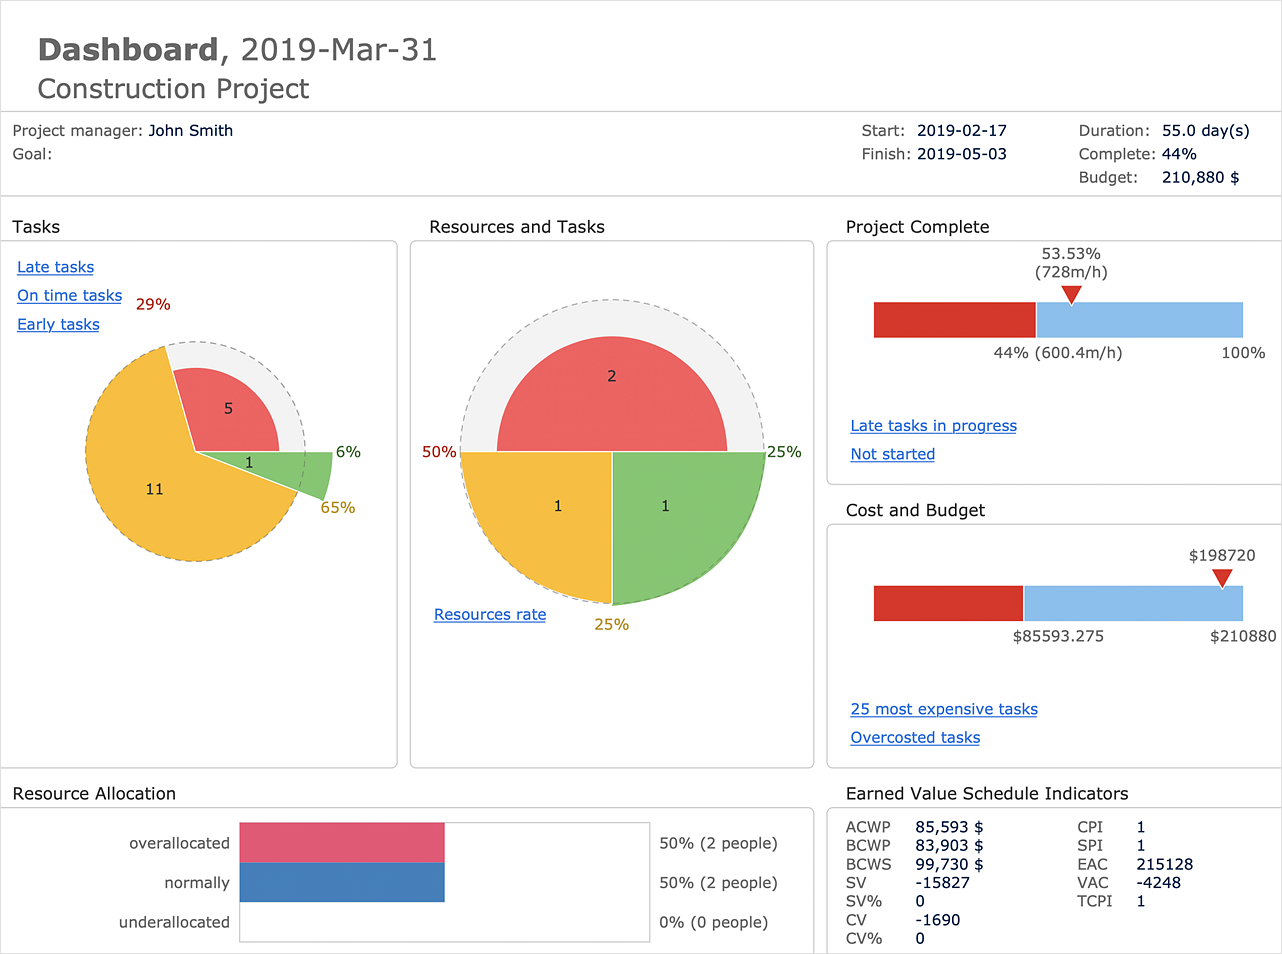
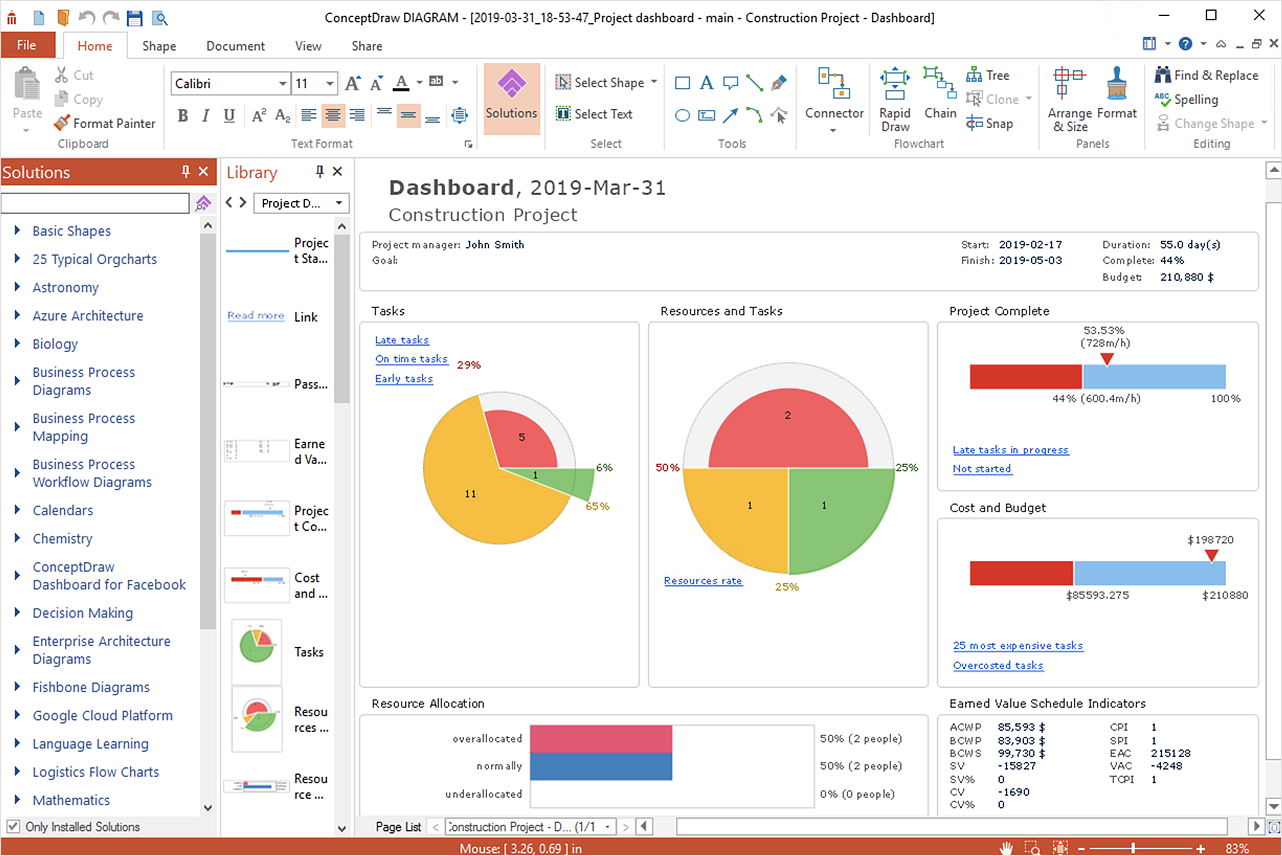
The visual Project Dashboard within ConceptDraw OFFICE is the best way to deliver a clear view of project performance to all project participants.Sales Dashboard Screenshot
ConceptDraw DIAGRAM software exteneded with the Sales Dashboard solution is perfect for visualizing sales data. This is the best tool to analyse your sales perfornance and see how your business can improve.HelpDesk
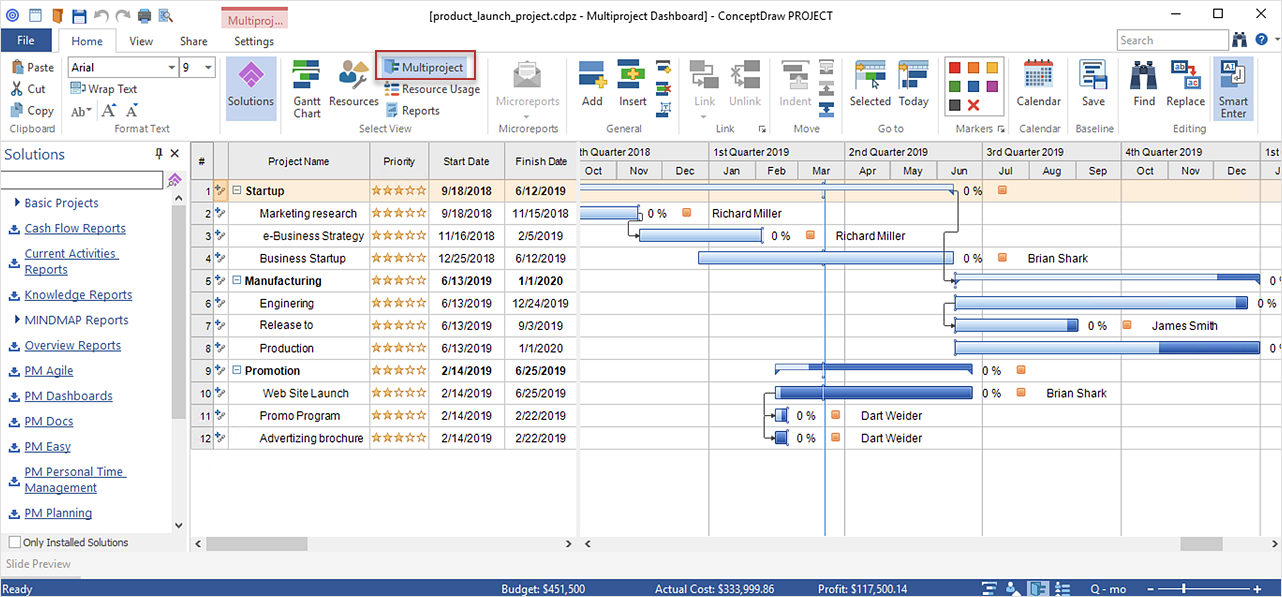
How to Manage Multiple Projects on Windows
ConceptDraw PROJECT lets you to track multiple projects at the same time.Customer Relationship Management
Customer relationship management is an important component of sales success. Visualizing sales data you may put some KPI related to customers relationship management to your Sales dashboard and track this important aspect in real time.- PM Dashboards | Project management task status dashboard ...
- Project Dashboard Example
- Multiple Project Dashboard Template Excel
- Construction Project Management Dashboard Template
- Progress Dashboard Examples
- Project task status dashboard - Template | Status Dashboard | PM ...
- Project Dashboard Examples Free
- Status Dashboard | Project task status dashboard - Template | PM ...
- Dashboard Project Management Kpi
- Project management task status dashboard | Project task status ...

