"Project planning is part of project management, which relates to the use of schedules such as Gantt charts to plan and subsequently report progress within the project environment.
Initially, the project scope is defined and the appropriate methods for completing the project are determined. Following this step, the durations for the various tasks necessary to complete the work are listed and grouped into a work breakdown structure. Project planning is often used to organize different areas of a project, including project plans, work loads and the management of teams and individuals. The logical dependencies between tasks are defined using an activity network diagram that enables identification of the critical path. Float or slack time in the schedule can be calculated using project management software. Then the necessary resources can be estimated and costs for each activity can be allocated to each resource, giving the total project cost. At this stage, the project schedule may be optimized to achieve the appropriate balance between resource usage and project duration to comply with the project objectives. Once established and agreed, the project schedule becomes what is known as the baseline schedule. Progress will be measured against the baseline schedule throughout the life of the project. Analyzing progress compared to the baseline schedule is known as earned value management.
The inputs of the project planning phase include the project charter and the concept proposal. The outputs of the project planning phase include the project requirements, the project schedule, and the project management plan." [Project planning. Wikipedia]
The flow chart example "Project planning process" was created using the ConceptDraw PRO diagramming and vector drawing software extended with the Flowcharts solution from the area "What is a Diagram" of ConceptDraw Solution Park.
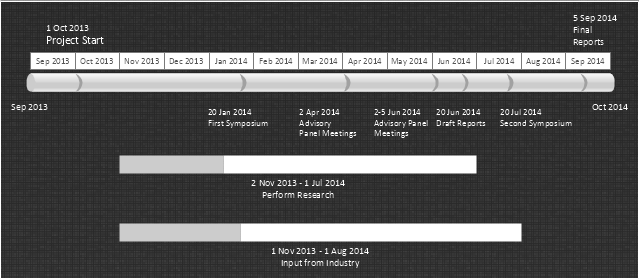
"In project management, a schedule is a listing of a project's milestones, activities, and deliverables, usually with intended start and finish dates. Those items are often estimated in terms of resource allocation, budget and duration, linked by dependencies and scheduled events. A schedule is commonly used in project planning and project portfolio management parts of project management. Elements on a schedule may be closely related to the Work Breakdown Structure (WBS) terminal elements, the Statement of work, or a Contract Data Requirements List." [Schedule (project management). Wikipedia]
The timeline diagram example "Project schedule" was created using the ConceptDraw PRO diagramming and vector drawing software extended with the Timeline Diagrams solution from the Management area of ConceptDraw Solution Park.
The timeline diagram example "Project schedule" was created using the ConceptDraw PRO diagramming and vector drawing software extended with the Timeline Diagrams solution from the Management area of ConceptDraw Solution Park.
 PM Easy
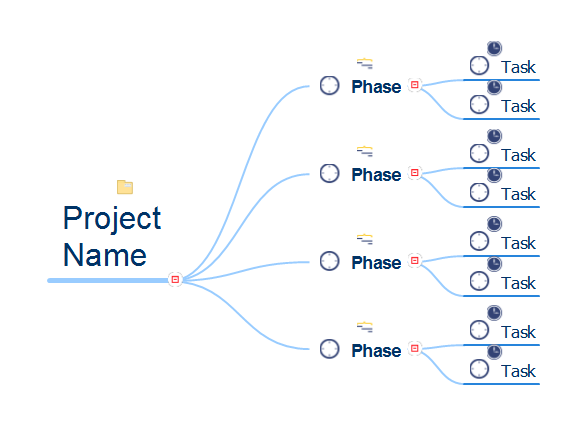
PM Easy solution extends the ConceptDraw PROJECT functionality with an ability to support neutral methodology of project management and to quickly start a project by listing the task relationships and dependencies, that makes the iterative planning much easier. The project management tool and available visual tools, such as mind mapping, increase the effectiveness of tracking and analysis your project tasks. PM Easy solution from ConceptDraw Solution Park is mainly targeted at project managers in small or medium-sized companies, allowing them to make the project plan and execute projects using mind mapping technique, to implement planning using mind mapping, and to track tasks using ConceptDraw PROJECT application.
 PM Mind Maps and Tables
PM Mind Maps and Tables solution extends the functional abilities of ConceptDraw DIAGRAM and ConceptDraw MINDMAP software with a set of drawing tools, professionally developed samples and templates allowing to prepare the project documentation including wide set of charts, tables, matrices, and Mind Maps. Being intended for the project manager, senior managers, team leaders and other project team members, it facilitates the execution of main project manager duties, contributes effective project planning and project management process implementation, increasing productivity in project planning, documenting, project presentation, tracking the progress and reporting.
Gantt Chart Diagram
Gantt Chart is a popular type of bar charts and widely used projects planning method. It helps to illustrate the plan for some project, the progress of tasks, the resources planning, the schedule of works and working time. The Gantt Chart contains a set of intervals (bars) located on the time axis and reflects the use of resources by objects. Each bar represents a separate task in the project, its length is a duration of the work. The vertical axis of the graph represents the list of tasks. Besides, the chart can contain additional data, such as the percents of complete, the total tasks, the tasks dependencies, the key points (milestones), etc. The use of Gantt Chart greatly simplifies the project management and enables to visualize in visual and compressed view the most important information of the project, what resources are used for execution the certain tasks and which must to be the speed of their execution. ConceptDraw Office suite applications help to cope perfectly the project management tasks, to construct easily the basic structure of your project and create a Gantt Chart Diagram. PM Easy solution allows you to plan and execute the projects using the mind mapping technique, to implement planning using mind mapping, and track tasks using ConceptDraw Project.WBS Diagram
To simplify the managing of a complex project, it is advisable to divide it into the components in a hierarchical tree structure, called by Work Breakdown Structure (WBS). WBS diagram clearly divides all the works and tasks that must be done to achieve the objectives of the project, into the smaller operations and actions. Such division of the project accelerates the allocation of resources and establishes the areas of responsibility for each team member. WBS diagram is one of the main planning tools frequently used by project managers, it allows you to clearly define the entire scope of work on the project, to describe in details the content of these works and to arrange them in a form of hierarchical structure. The better you detailing the WBS, the more accurate will be all actions. The optimal size of elements is from the few days to several months. ConceptDraw Office suite applications and ConceptDraw Solution Park contain a lot of tools actively applied in project management, in their quantity is included the possibility of easy creation professional-looking Work Breakdown Structure (WBS) diagrams.Product Overview
ConceptDraw PROJECT is a vigorous tool for managing single or multiple projects. It lets you determine all essential elements involved into project, control schedules, resources and finances, and monitor projects' progress in most effective yet simple manner.
 Project Diagrams
The Project Diagrams solution extends the ConceptDraw DIAGRAM software functionality with special tools, large set of samples pre-made in ConceptDraw DIAGRAM and ConceptDraw MINDMAP, and collection of predesigned vector shapes, arrows, table and frame objects for easy drawing the Project Diagrams of different kinds, Hierarchical Charts, Influence Diagrams, Work Breakdown Structures (WBS), Organization Breakdown Structures (OBS), and Resource Breakdown Structures (RBS), PERT Chart or PERT Diagram, Project Management Chart, Project Network Diagram, Network Diagram Project Management, Project Timeline, Precedence Diagram, Gantt Diagram or Gantt Chart. Plan your project, visualize the main stages, and track your project’s implementation effectively with ConceptDraw DIAGRAM. Use also ability to autogenerate Project Diagrams from ConceptDraw MINDMAP to ConceptDraw DIAGRAM.
 Stakeholder Onion Diagrams
The Stakeholder Onion Diagrams solution supplies ConceptDraw DIAGRAM with powerful tools to simplify the process of creating Stakeholder Onion Diagrams. It includes the set of pre-made vector objects and templates for a quick start, and collection of examples illustrating the solution's power. This solution is useful for all specialists in management and business, especially for those who prefer to use the newest progressive tools.
Quick Project Start
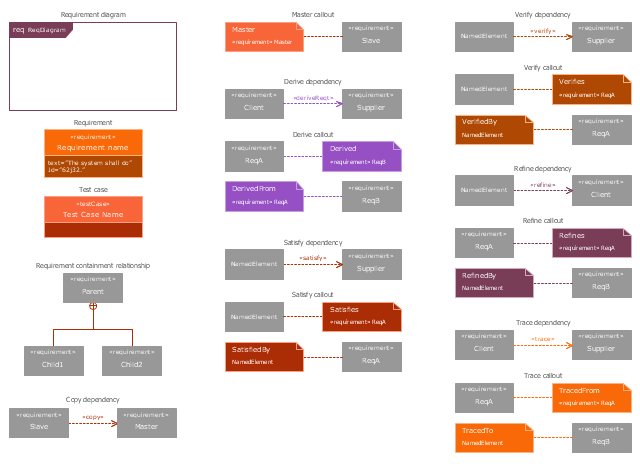
The rapid project startup and creation of initial project plan is possible and easy using effective and flexible mind mapping technique, which lets to gather requirements from your team and then plan activities in a visual mind mapping format. Using this technique you can establish time lines, delineate tasks, assign resources, and organize the overall project structure in a form of Mind Map. The ConceptDraw MINDMAP software, PM Easy solution and other offered PM solutions help in project management and support many project methodologies, including Agile and Scrum. ConceptDraw Toolbox solutions help to deal easy with common project situations, they are helpful for planning projects, tracking the milestones, events and resource usage, and for many other functions typical for project management. ConceptDraw MINDMAP software helps project managers effectively create the plan for high level tasks and milestones, set the tasks relations and dependencies, represent the project plan as a Mind Map, successfully start and realize the project of any size, and track the tasks using the ConceptDraw Project.The vector stencils library "Requirement diagram" contains 21 SysML symbols.
Use it to design your requirement diagrams using ConceptDraw PRO diagramming and vector drawing software.
"A requirement specifies a capability or condition that must (or should) be satisfied. A requirement may specify a function that a system must perform or a performance condition a system must achieve. SysML provides modeling constructs to represent text-based requirements and relate them to other modeling elements. The requirements diagram described in this clause can depict the requirements in graphical, tabular, or tree structure format. A requirement can also appear on other diagrams to show its relationship to other modeling elements. The requirements modeling constructs are intended to provide a bridge between traditional requirements management tools and the other SysML models.
A requirement is defined as a stereotype of UML Class subject to a set of constraints. A standard requirement includes properties to specify its unique identifier and text requirement. Additional properties such as verification status, can be specified by the user.
Several requirements relationships are specified that enable the modeler to relate requirements to other requirements as well as to other model elements. These include relationships for defining a requirements hierarchy, deriving requirements, satisfying requirements, verifying requirements, and refining requirements." [www.omg.org/ spec/ SysML/ 1.3/ PDF]
The SysML shapes example "Design elements - Requirement diagram" is included in the SysML solution from the Software Development area of ConceptDraw Solution Park.
The vector stencils library "Project management" contains 30 project management icons.
Use it to design your business and finance illustrations and infographics with ConceptDraw PRO diagramming and vector drawing software.
"Project management is the discipline of initiating, planning, executing, controlling, and closing the work of a team to achieve specific goals and meet specific success criteria. A project is a temporary endeavor designed to produce a unique product, service or result with a defined beginning and end (usually time-constrained, and often constrained by funding or deliverables) undertaken to meet unique goals and objectives, typically to bring about beneficial change or added value." [Project management. Wikipedia]
The icon set example "Design elements - Project management" is included in the Business and Finance solution from Illustration area of ConceptDraw Solution Park.
- Responsibility assignment matrix - Template | | Deliverables
- Software development with ConceptDraw Products | | Project —Task ...
- Activity Network Diagram Method | Activity Network (PERT) Chart ...
- Project — Working With Costs | Project —Task Trees and ...
- Project —Task Trees and Dependencies | Task Management Plan
- Project —Task Trees and Dependencies | Project management life ...
- Project —Task Trees and Dependencies | How To Create ...
- Gantt charts for planning and scheduling projects | Project ...
- PERT chart - Project management plan
- How To Plan and Implement Projects Faster | Gant Chart in Project ...
- PM Easy | How to Report Task's Execution with Gantt Chart ...
- Process Flowchart | UML Class Diagram Example - Apartment Plan ...
- UML Class Diagram Example - Apartment Plan | Local area network ...
- Gantt chart examples | How To Plan and Implement Projects Faster ...
- Project plan timeline - Request for proposal (RFP) | Project Timeline ...
- Gantt chart examples | How To Plan and Implement Projects Faster ...
- ConceptDraw Arrows10 Technology | Wbs Diagram Examples
- PM Easy | Product Overview | Work Breakdown Structure Of A Project
- Project —Task Trees and Dependencies | ConceptDraw PROJECT ...
- Project —Task Trees and Dependencies | Project planning process ...


