HelpDesk
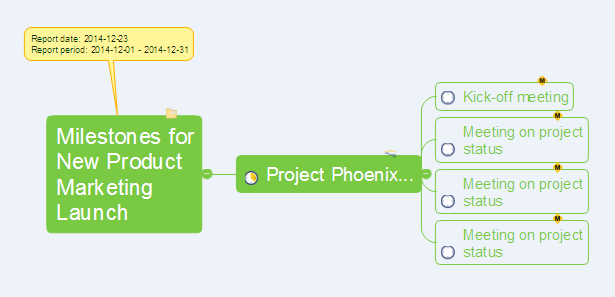
How to Report on Project Milestones Using a Mind Map
It's often necessary to report on project milestones while your project is under way. You can generate the Milestone report Mind Map.How to Report Task's Execution with Gantt Chart
ConceptDraw PROJECT’s powerful reporting engine lets you generate a set of tabular reports with just one click, or visualize your project as Radial Tasks Structures, Work Breakdown Structures and Resource Calendars. It also provides you with dynamic Project Dashboards.HelpDesk
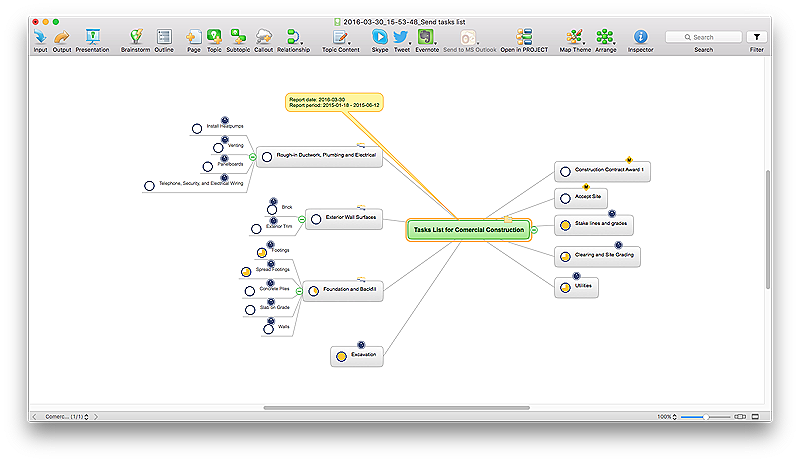
How to Generate ConceptDraw PROJECT Standard Reports on Mac
Project reporting is one of the key functions of effective project management. Using regular project reports, project manager can constantly track and analyze the project’s execution. This analytic process can help to ensure that the team reaches the best possible solutions. ConceptDraw PROJECT is a professional software tool for project management with the advanced mechanism of reporting. You can create the set of regular reports on project activities, task statuses, cash flow and assignments in MS Excel format. Mind map reports are also available.Timeline Examples
ConceptDraw PRO diagramming and vector drawing software offers the Timeline Diagrams solution from the Management area which is rich for the timeline examples, samples, templates and ready-to-use vector shapes.What is Gantt Chart (historical reference)
Historical reference about the Gantt chart.PERT Chart Software
PERT Chart Software - Activity Network and Project Evaluation and Review Technique, or PERT, charts are a way of documenting and analyzing the tasks in a project. ConceptDraw PRO is a powerful diagramming and vector drawing software for designing professional looking PERT Charts quick and easy.Stakeholder Onion Diagram Template
For depicting the onion model are actively used Stakeholder Onion Diagrams. The ConceptDraw PRO diagramming and vector drawing software extended with Stakeholder Onion Diagrams Solution from the Management Area of ConceptDraw Solution Park offers the number of useful tools and Stakeholder Onion Diagram template for their easy design.Gantt Chart Software
The Gantt Chart is the main interface in ConceptDraw PROJECT. It summarizes the tasks in your project and presents them graphically so you can easily view your progress.Project —Task Trees and Dependencies
Users new to ConceptDraw PROJECT will find the Basic lessons an essential platform for familiarizing themselves with the program′s functions. This video lesson will teach you how to set up task trees and dependencies.Project — Working With Costs
ConceptDraw PROJECT delivers a rich set of built-in functionalities and optional product extensions that support your daily workflow in time-saving and creative ways. This video lesson will teach you how to work with costs in your project document.How To Plan and Implement Projects Faster
ConceptDraw Office is the most effective tool for planning, tracking, and reporting all types of projects with strong management capabilities, user friendly functionality, and superior ease of use. In this tutorial video we will assist you in planning and managing a project using ConceptDraw Office.Build Strategies Exchanging Mind Maps with Evernote
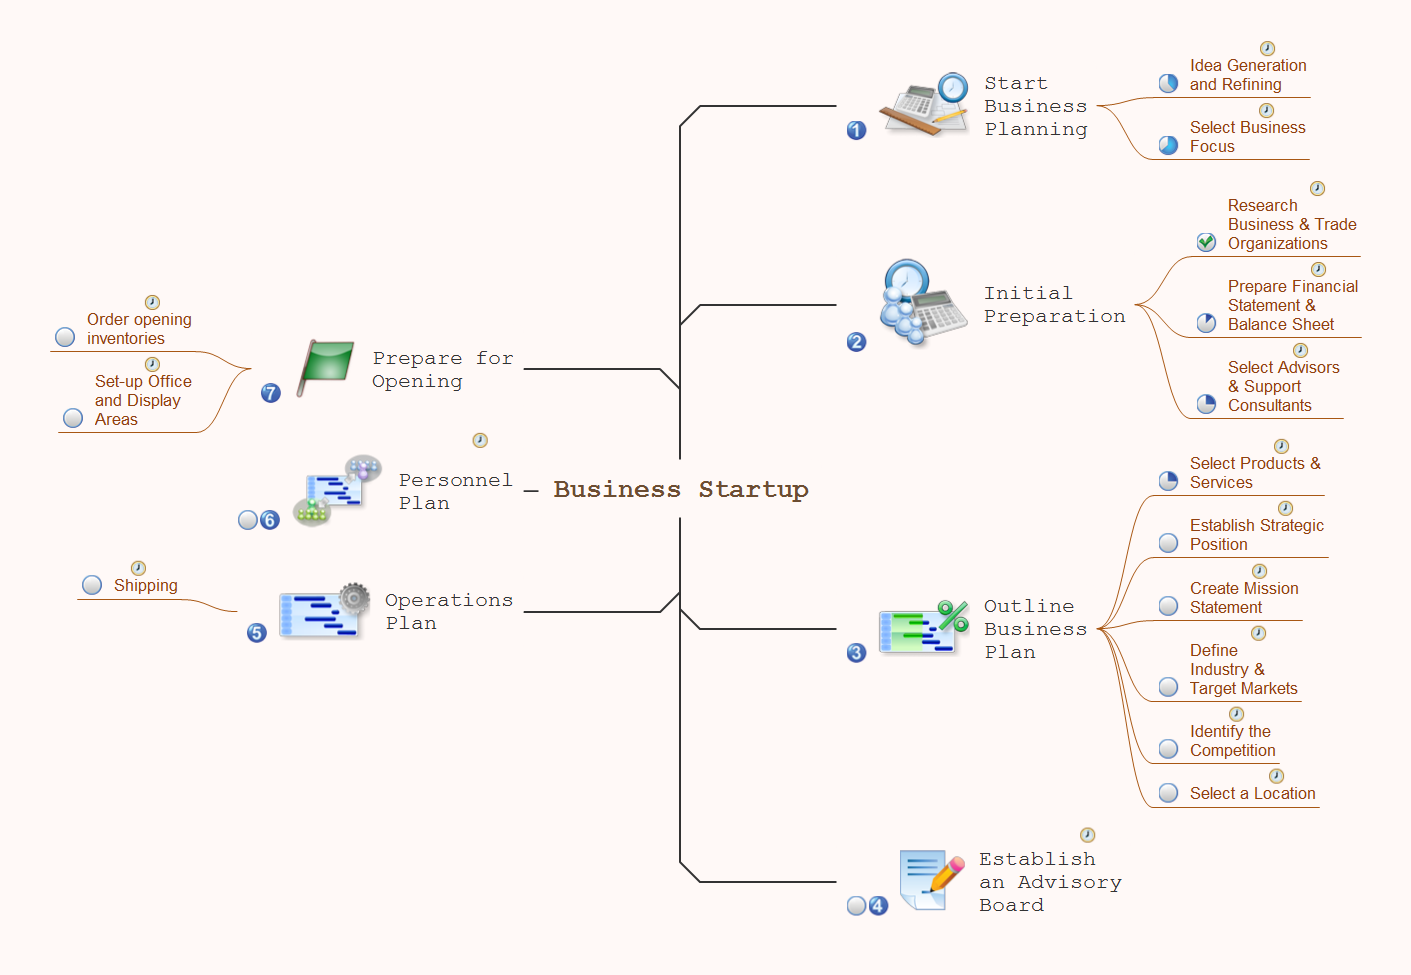
To build Strategies - powerful feature of ConceptDraw MINDMAP allows to combine the power of MINDMAP with the accessibility of the world’s favorite human memory platform, Evernote.Task Board
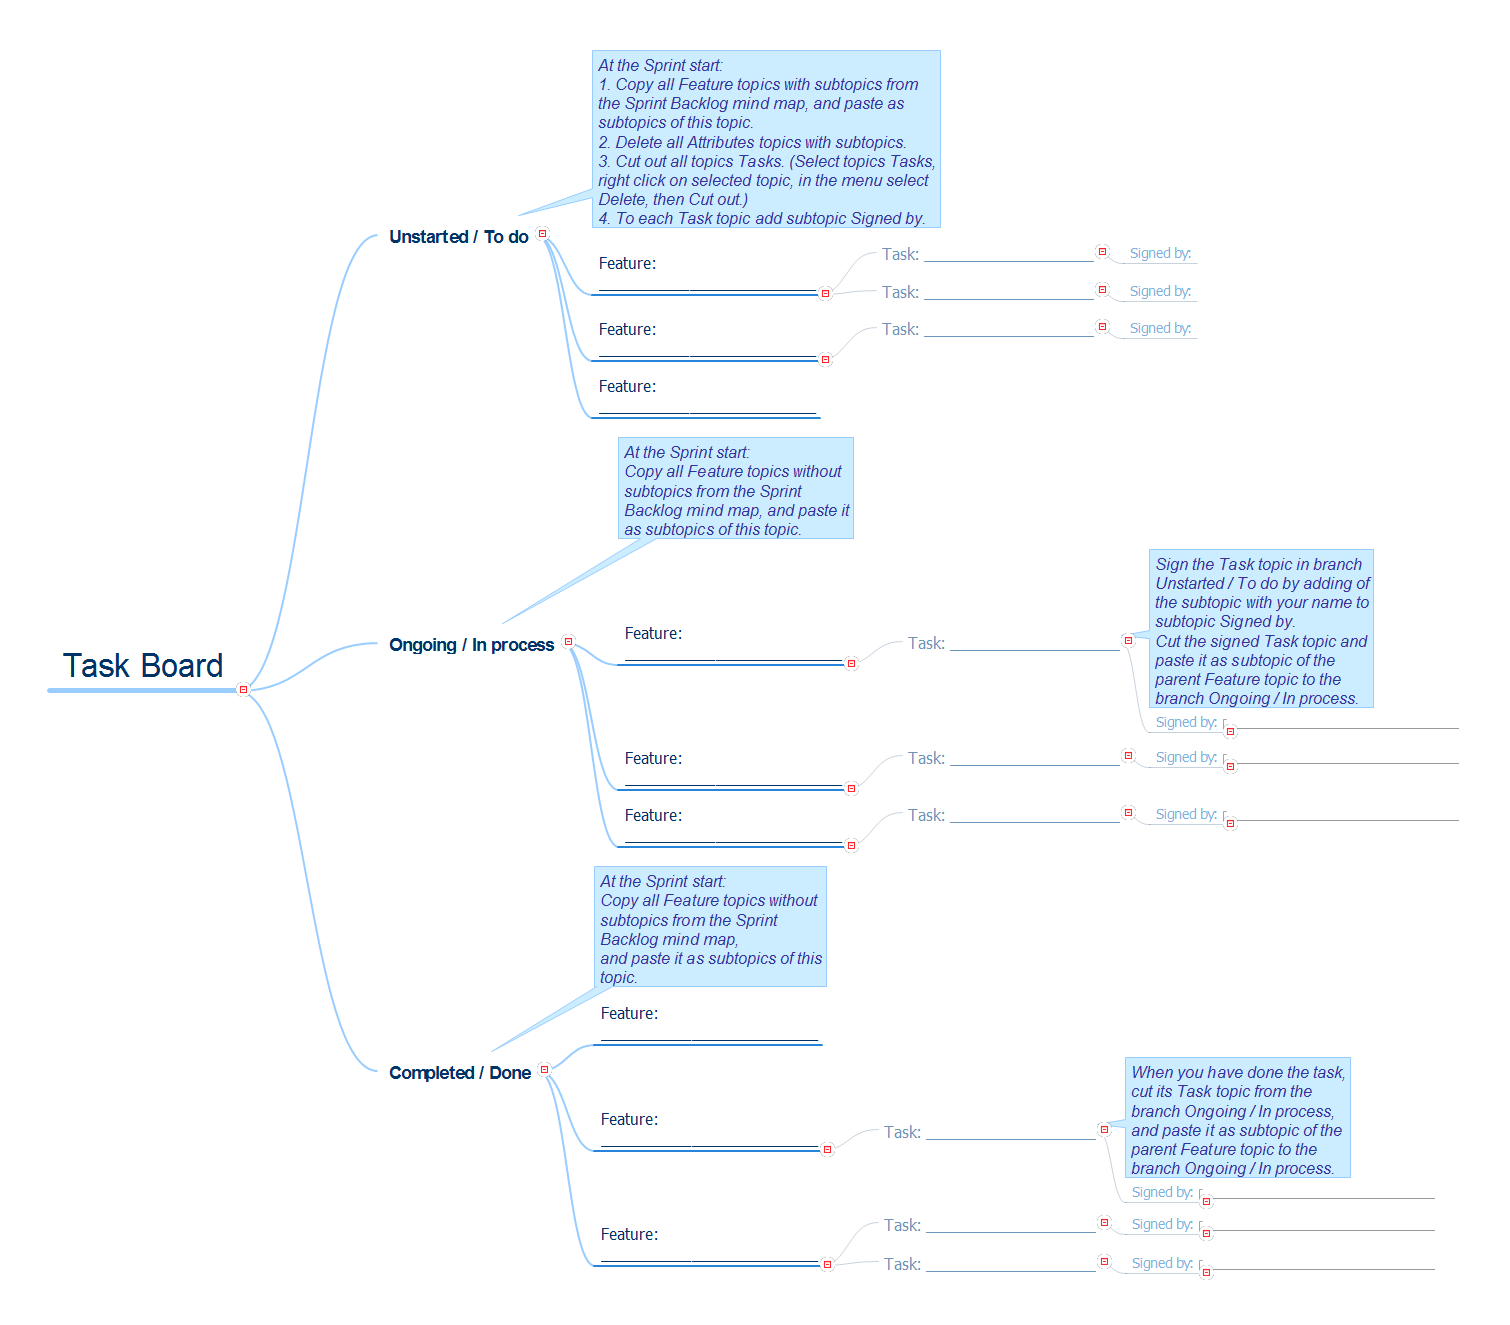
Use Task Board to visualize the Scrum-ban Task Board as a mind map.HelpDesk
How to Draw a Gantt Chart Using ConceptDraw PRO
A Gantt chart is intended to provide a visualization of a project schedule. It is developed to help planning, coordinating, and tracking on project tasks implementation. One of the most critical resources for a project implementation is a time resources. Gantt chart - is one of the most convenient and popular way of graphical representation of a project tasks progress in conjunction with the corresponding time consumption. Gantt chart's function is to show project tasks completion in a progress, and to make a project manager sure that project tasks were completed on time. ConceptDraw Office is a clear and easy-to-use tool for project management. It is a very handy visual tool that helps make a project processing clear.- Milestone Project Management Example
- How to Report on Project Milestones Using a Mind Map | One ...
- Project Timeline | How to Identify Project Milestones | How to Report ...
- How to Identify Project Milestones | How to Create a Timeline ...
- How to Report on Project Milestones Using a Mind Map | How to ...
- How to Identify Project Milestones | How to Report on Project ...
- How to Report on Project Milestones Using a Mind Map | PM Easy ...
- How to Report Task's Execution with Gantt Chart | PM Easy | How to ...
- TQM Diagram Example | Business Report Pie. Pie Chart Examples ...
- How to Report on Project Milestones Using a Mind Map
- How to Identify Project Milestones | How to Create a Timeline ...
- How to Generate ConceptDraw PROJECT Standard Reports on PC
- Sales Report Mind Map
- How to Report on Project Milestones Using a Mind Map | PM Easy ...
- Business Report Pie. Pie Chart Examples | Pie Chart | Process ...
- How to Report Task's Execution with Gantt Chart | How to Identify ...
- Diagram Of An Overall Business Plan Milestone
- Workflow Diagram | How To Create Project Report | How to Publish ...
- Quality Project Management with Mind Maps | How to Manage a ...
- Project Kpi Examples


