HelpDesk
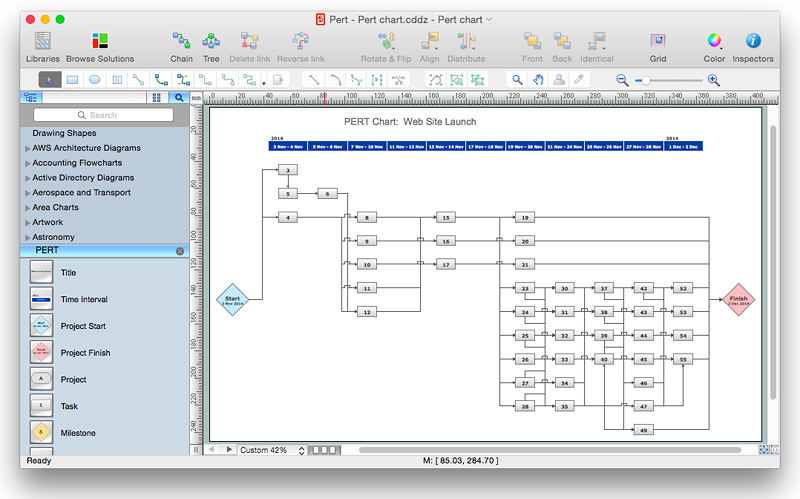
How to Create Project Diagrams on Mac
Diagrams are very useful for project implementation because they help teams visualize important details such as interrelations between tasks, critical paths, timelines, milestones, calendars, and also resource usage.HelpDesk
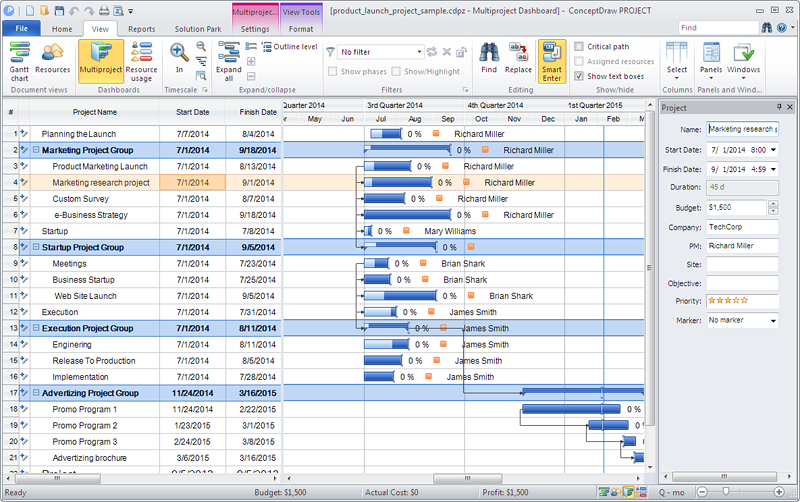
How to Draw a Gantt Chart Using ConceptDraw PRO
A Gantt chart is intended to provide a visualization of a project schedule. It is developed to help planning, coordinating, and tracking on project tasks implementation. One of the most critical resources for a project implementation is a time resources. Gantt chart - is one of the most convenient and popular way of graphical representation of a project tasks progress in conjunction with the corresponding time consumption. Gantt chart's function is to show project tasks completion in a progress, and to make a project manager sure that project tasks were completed on time. ConceptDraw Office is a clear and easy-to-use tool for project management. It is a very handy visual tool that helps make a project processing clear.
 PM Presentations
This solution extends ConceptDraw MINDMAP and ConceptDraw PRO software, improving the efficiency of the project management process by using the same source data to build targeted presentations.
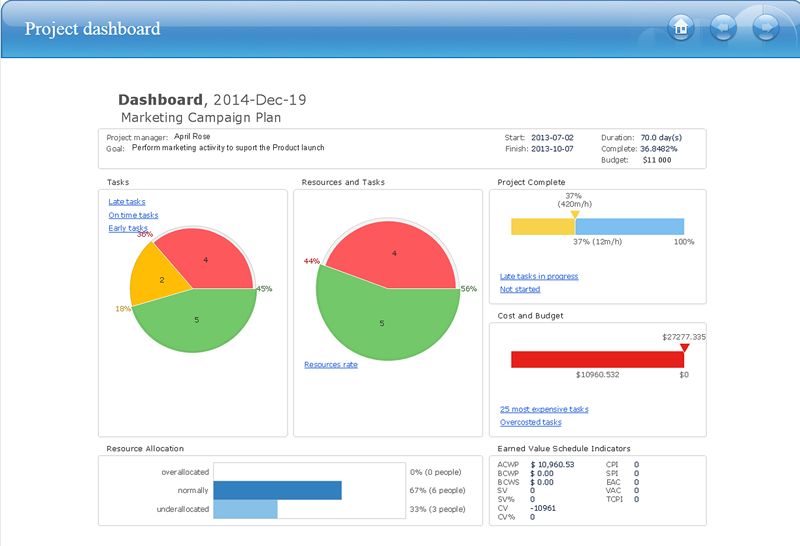
 Status Dashboard
Status dashboard solution extends ConceptDraw PRO software with templates, samples and vector stencils libraries with graphic indicators for drawing the visual dashboards showing status data.
Communication Tool for Remote Project Management
Communication is the main challenge and the key success factor for remote project management. Communicating visually via Skype you bring all team and customers onto the one page. Remote Presentation for Skype solution for ConceptDraw MINDMAP helps communicate with remote team and customers in visual manner on wide range of issues. Using this solution for regular status meetings allows you to push your team on tasks and keep task statuses up to date.How to Create Presentation of Your Project Gantt Chart
During the planning, discussing and execution of a project you may need to prepare a presentation using project views such as the Gantt Chart, Multiproject Dashboard or Resource Usage View. It’s easy do with ConceptDraw PROJECT!HelpDesk
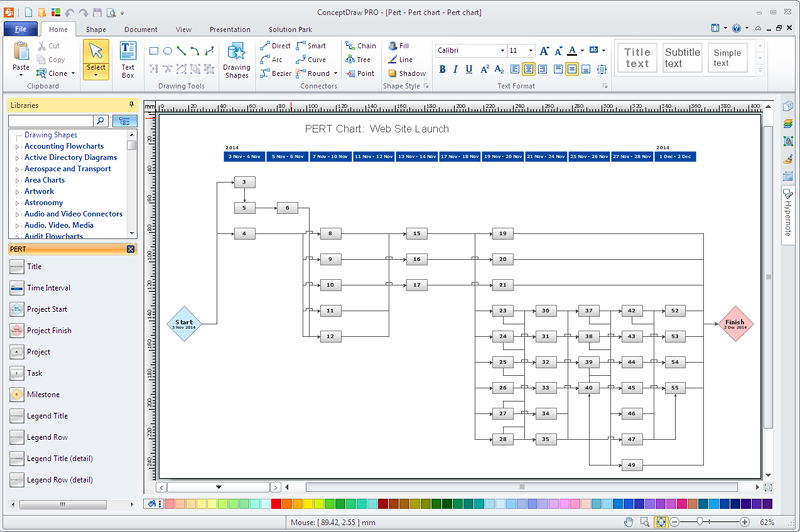
How to Create Project Diagrams on PC
Visual diagrams gives the ability to view at a detailed level project attributes such as project scope, logical connections in the project, critical paths, key events on the timeline, milestones, tasks, calendars for work, and resource utilization.How To Hold Project Collaboration via Skype
Project Management Trends. Status report presentation tool for remote teams, using Skype to collaborate on project objectives.
HelpDesk
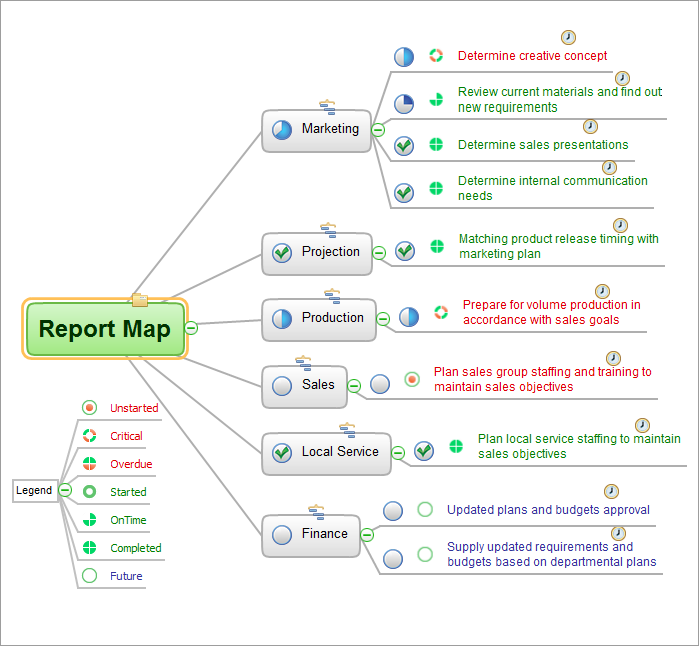
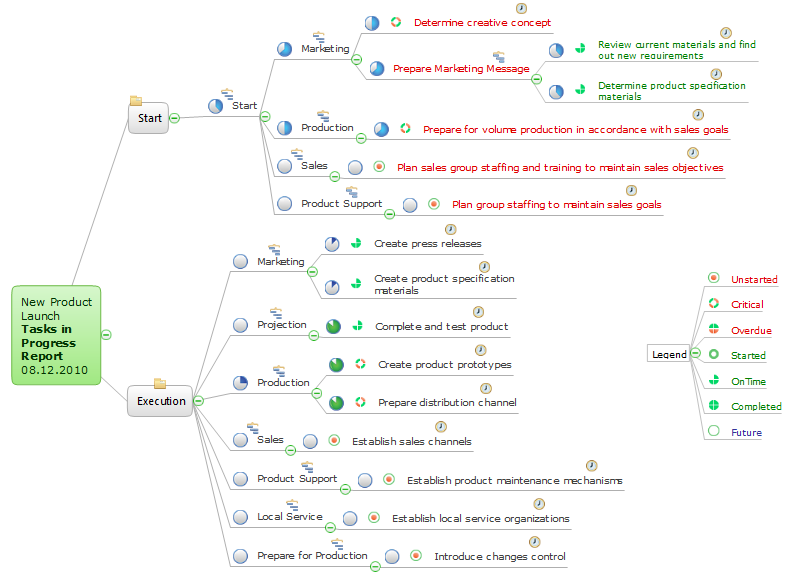
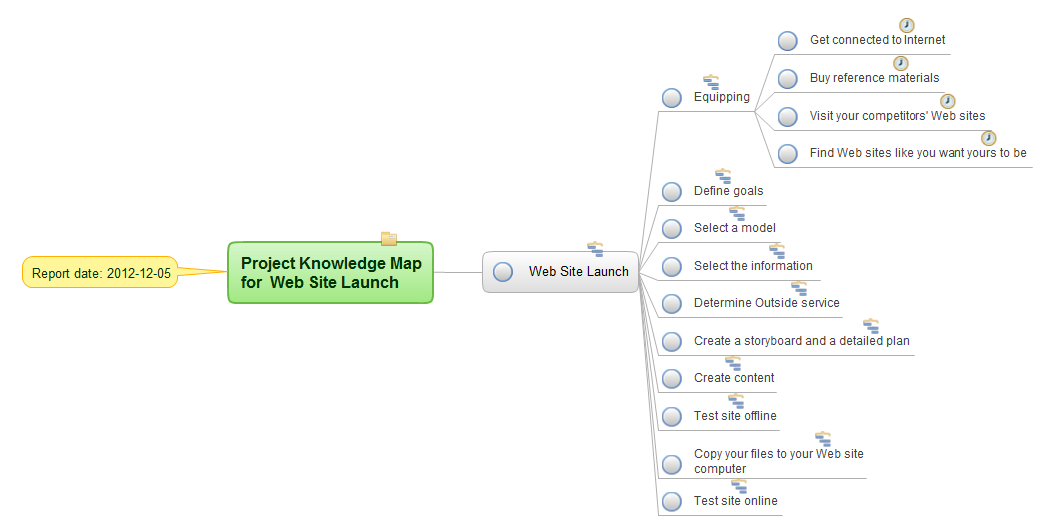
How to Publish Project Reports on the Web Using ConceptDraw PRO
Reporting is an important part of project management. Every project manager is regularly asked how the project is progressing. ConceptDraw Office offers different ways in which to provide a project status.HelpDesk
How to Manage Multiple Projects on Windows
ConceptDraw PROJECT lets you to track multiple projects at the same time.How To Show Project Progress Peport on Web
Project progress on web: delivering project status to remote teams and stakeholders via Skype.
 ConceptDraw PRO for PROJECT
Project Diagrams suite is a unique tool that demonstrates the power and compatibility of ConceptDraw software, this bundle helps to create dashboards and visual reports. The multiple types of reports help to present project status in a simple and visuall
HelpDesk
How to Create a Venn Diagram in ConceptDraw PRO
Venn diagrams were invented by John Venn as a method of depicting relationships between different components. A Venn diagram consists of two or more circles. Each circle represents a specific group or set. The entities which are depicted by circles generally have some common characteristics. A Venn Diagram shows all the possible logical relations between these entities. Any properties that belong to more than one set should be indicated in the sections where the circles overlap. A Venn Diagram can be useful to visually summarize the status and future viability of a project. ConceptDraw PRO allows you to make a Venn diagrams using the Venn Diagrams solution.How To Use Collaboration Tool in Project Management
Collaboration tool for project management enables you to give a new role to knowledge management and document sharing within your team.
 PM Dashboards
This solution extends ConceptDraw PRO and ConceptDraw PROJECT software with the ability to clearly display the identified key performance indicators for any project.
- Erd Status
- Project Status Dashboard For Software Industries
- Status Dashboard | Frequency Distribution Dashboard | UML Activity ...
- Status Diagram
- Workflow Diagram | How To Create Project Report | How to Publish ...
- Timeline Diagrams | Timeline Examples | Timeline Diagrams ...
- Activity on Node Network Diagramming Tool | Process Flowchart ...
- Status Diagram For Onine Bookstore Project
- How to Create a Timeline Diagram in ConceptDraw PRO | Project ...
- Multiple Diagram Detail Report Of Project
- Project Management Venn Diagram
- Venn Diagrams | PM Planning | Project Exchange | Venn Diagram In ...
- Status Dashboard | PM Dashboards | PM Presentations | Dashboard ...
- Root Cause Tree Diagram | Project —Task Trees and ...
- How to Publish Project Reports on the Web Using ConceptDraw PRO
- UML Deployment Diagram . Design Elements | UML in 10 mins ...
- How to Create Project Diagrams on Mac | Project Exchange | How to ...
- How to Publish Project Reports on the Web Using ConceptDraw ...
- How To Create Project Report | How to Generate ConceptDraw ...
- How to Publish Project Reports on the Web Using ConceptDraw ...
